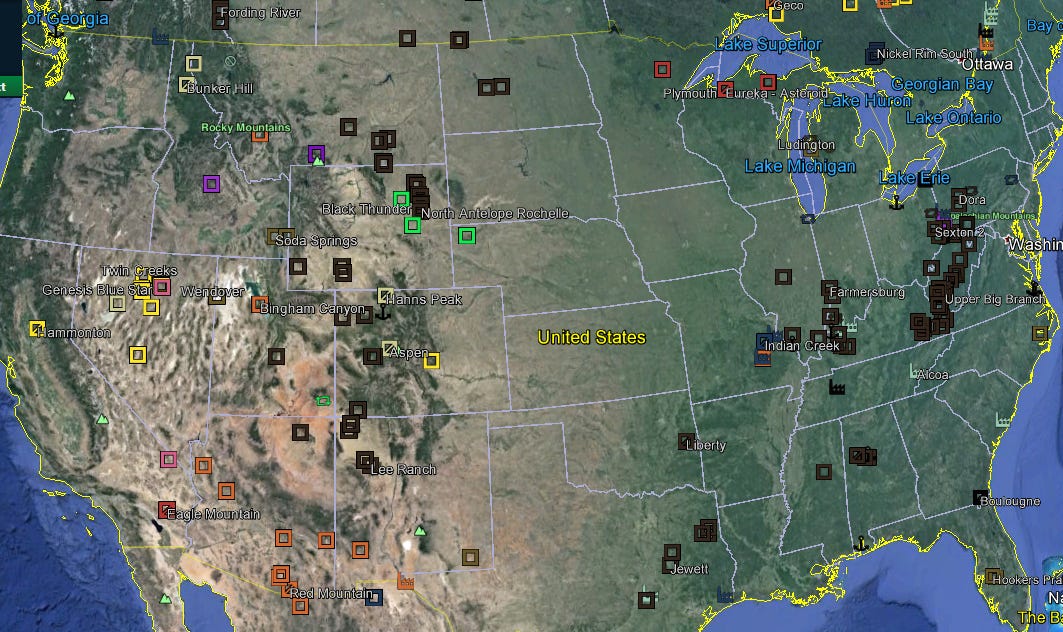
That's gold (yellow, of course) in northern Nevada, copper (burnt orange) in the Southwest, coal (black) in Wyoming and West Virginia, and iron ore (looks like the copper color) around Lake Superior.
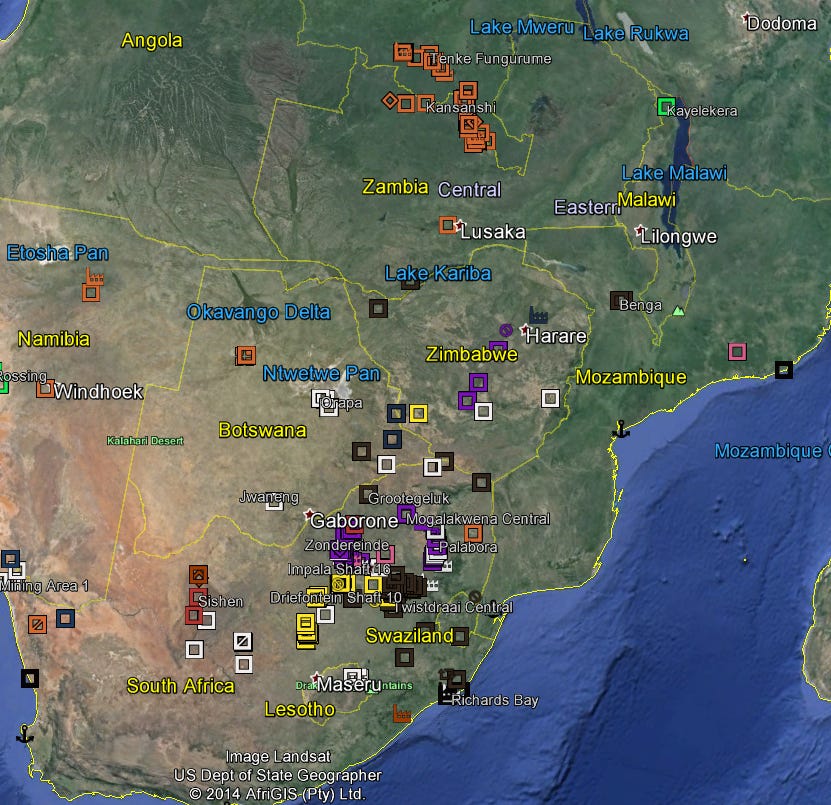
Here's copper in the (brilliant name!) Copperbelt, shared by the Democratic Republic of the Congo (DRC) and Zambia. (The mines are mostly in or near the DRC’s southeastern prong, or pedicle, which nearly cuts Zambia in half.) There's gold in South Africa. White is diamonds.
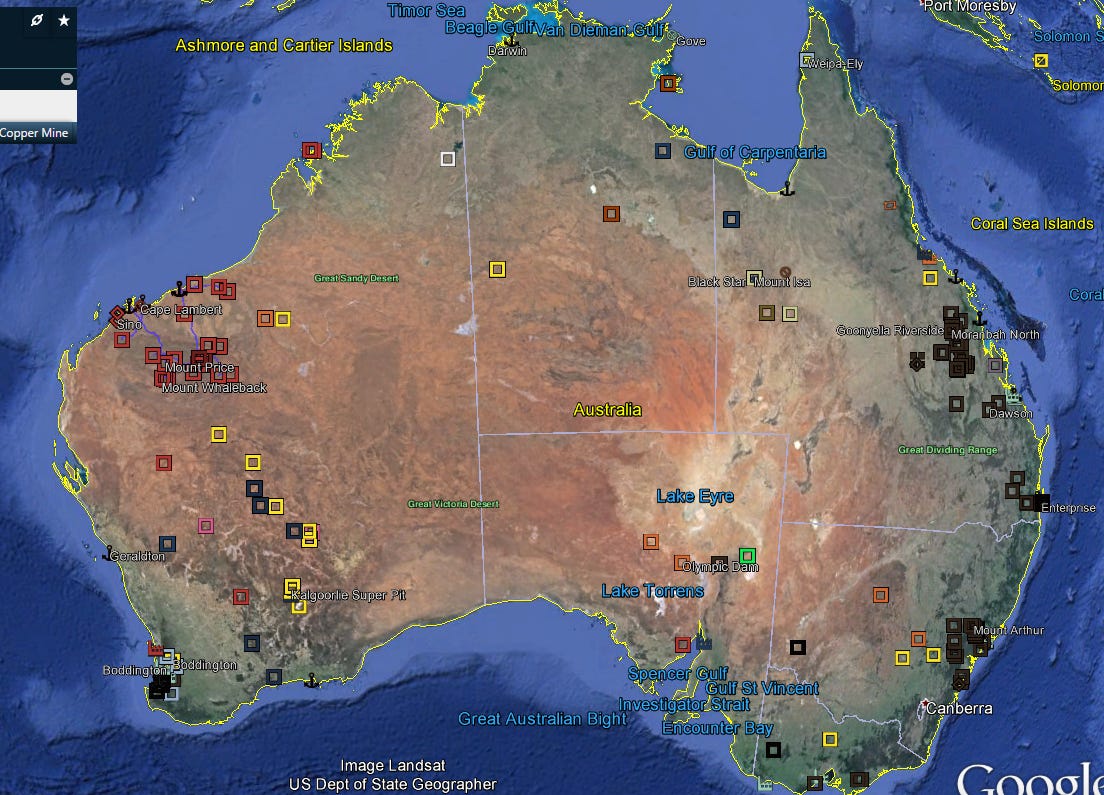
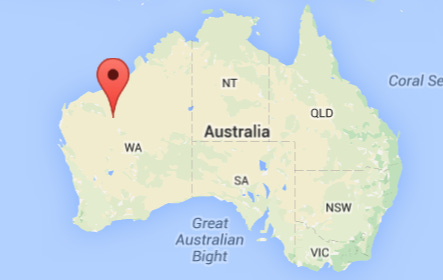
That’s coal mostly on the east coast, iron ore in the NW, and gold farther south
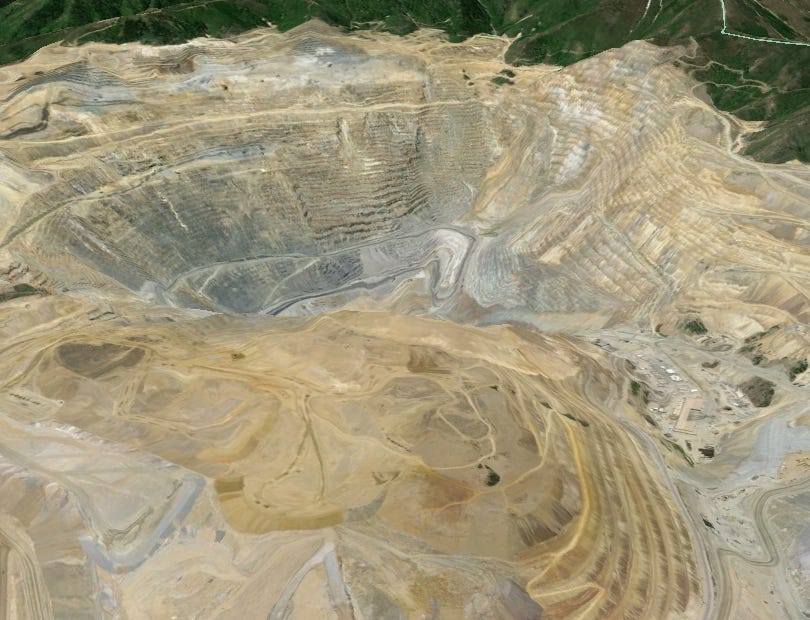
The previous maps don't tell you anything about the size of these mines, but many of them are huge. Here's the Bingham Canyon Mine, alias the Kennecott Copper Mine, near Salt Lake City. The mine has produced copper and other minerals for about a century. It's still going strong.
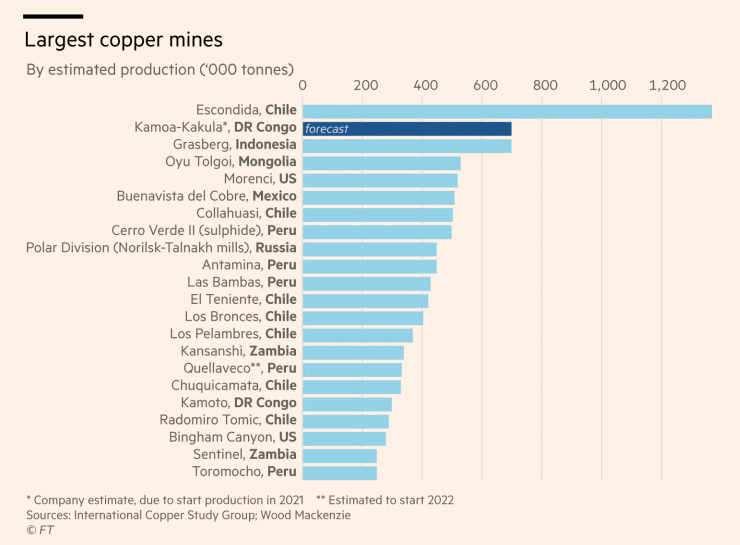
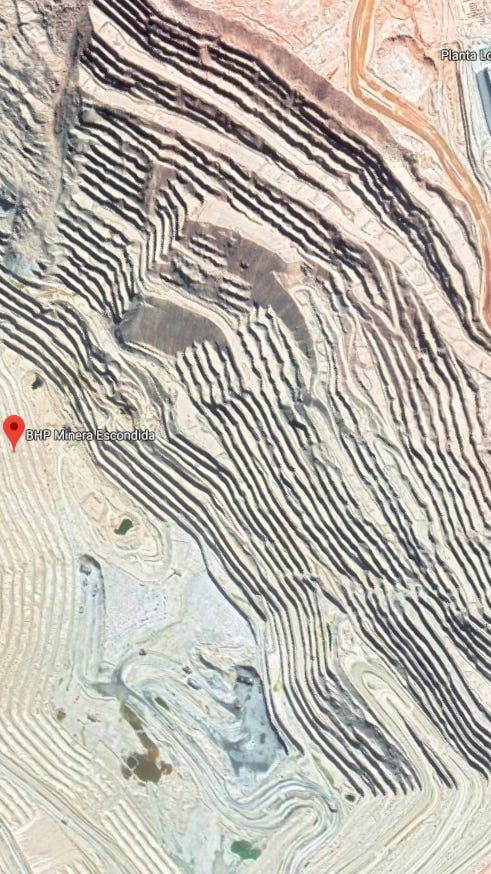
Here’s a bit of Escondida, the biggest copper mine. It’s about an 18-hour drive north of Santiago.
How do you make holes this big—in this case the Superpit, a gold mine at Kalgoorlie, in Western Australia? Answer: see the three trucks on the right, growling their way out of the pit?
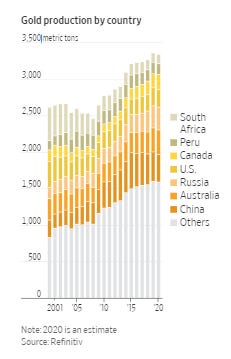
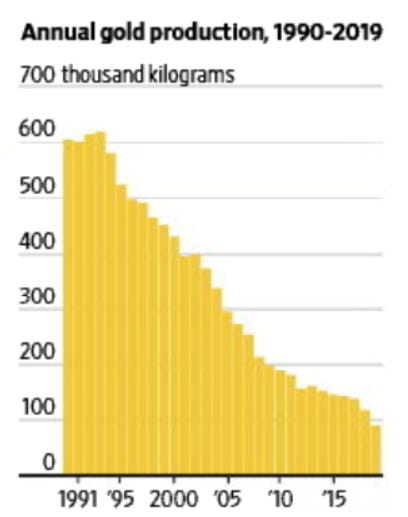
Is Australia a big producer of gold? The metal comes from lots of countries, and no one country dominates production. Maybe Australia ranks second; it certainly is in the top handful. See South Africa? See it declining?
As late as 2007, South Africa was the world’s top producer, but its mines are deep-shaft mines, not open pits, which means that high labor costs make them increasingly uneconomical.
Anyway, here’s a mining truck. The “tray” carries 65 tons of ore. For those of you fond of your five-liter muscle car: the engine displacement here is 27 liters.
Other trucks in the industry are bigger, carrying loads up to 400 or 500 tons.
Moving these things can be a challenge. Here’s a flatbed truck carrying a tray from South Africa north to the coal mines of Mozambique (I think!).
I saw a bunch of these one day. Here was another, slowly, slowly trundling through Chivhu, Zimbabwe.
Here’s one of the shovels used to load the trucks. It’s hard to gauge the size of this thing, but this bucket has a capacity of 10 cubic meters. Big? Small? Depends on your perspective.
Same shovel. It was a kind of souvenir in a small hotel in the town of Newman, Western Australia, and this was the view when I stepped out of my room. Felt a bit like a Transformers movie.
This shovel had dug iron ore for about 20 years before being retired in 1989. I asked how the thing had been moved here: it weighs 370 tons. Nobody knew.
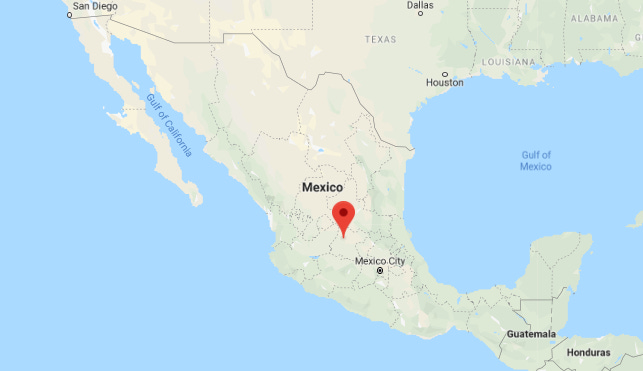
I try my best to avoid history in these files, but we’ve come for a moment to Guanajuato, site of the Mexican silver mines that once made Spain rich.
Here, a couple of miles from town, is the San Juan de Rayas mine. The massive platform was built to provide a floor from which to operate deep shafts.
San Juan de Rayas was the first of several mines in the vicinity. Here’s a neighbor, the Valenciana Mine, which peaked in the 1790s but was operating (as this modern headrig suggests) in recent years.
A view down the 1,500-foot shaft.
There were several entrances to this mine over the centuries. Here, during its construction, is the shaft we were just looking at.
Mine work was, by the standards of the time, well paid.
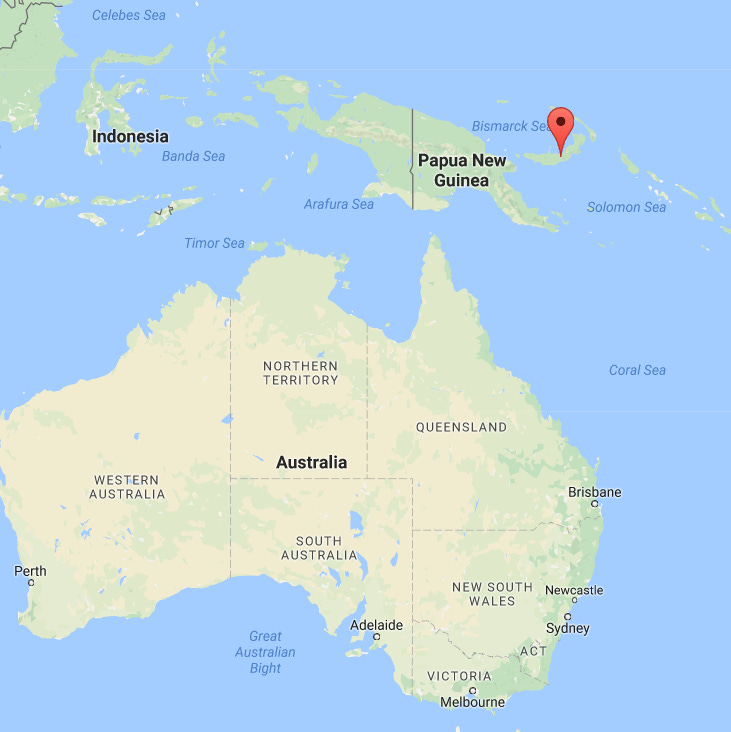
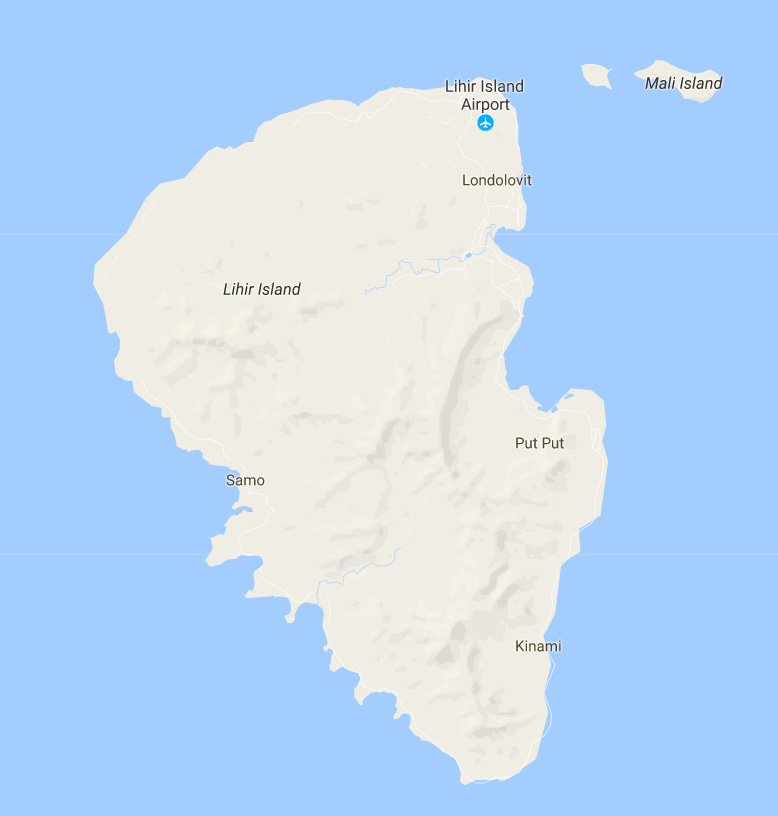
Miners often wind up in the remotest places you can imagine. Here, for example is the island of New Britain, part of the country of Papua New Guinea.
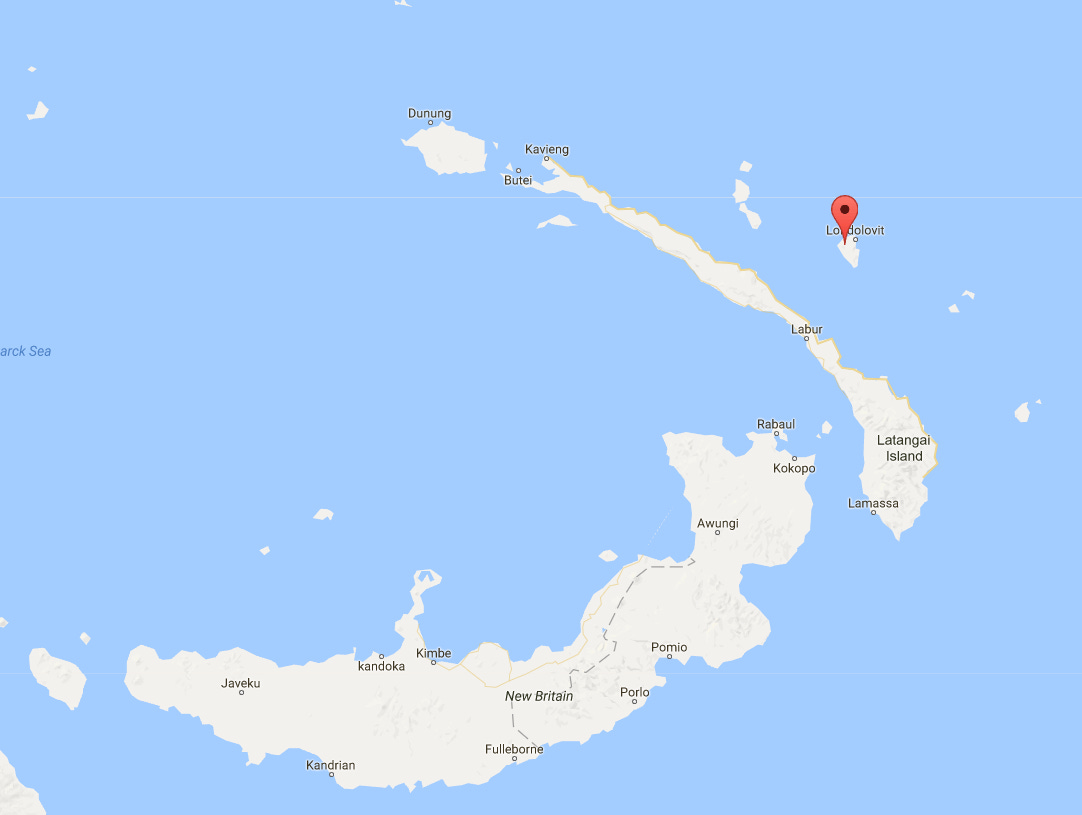
Here it is again, this time with a neighbor that used to be called New Ireland but is now Latangai Island. The pin is on a tiny volcanic island called Lihir.
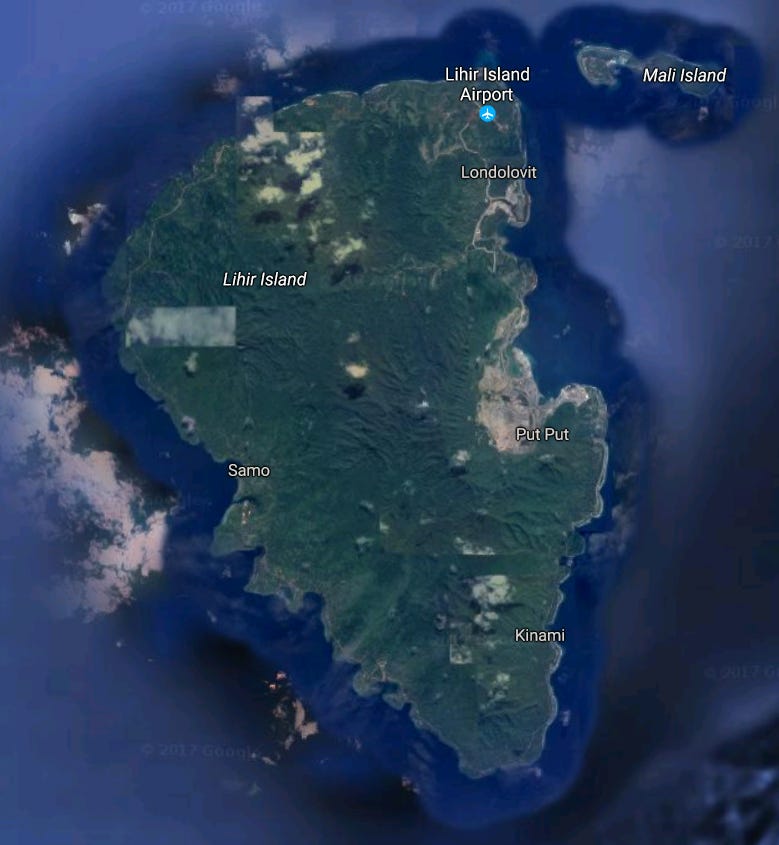
Gotta love Google Maps. You can see the crater edge of the old volcano, no longer active but still hot underneath, with steam seeps. Other than that, the place looks pretty quiet.
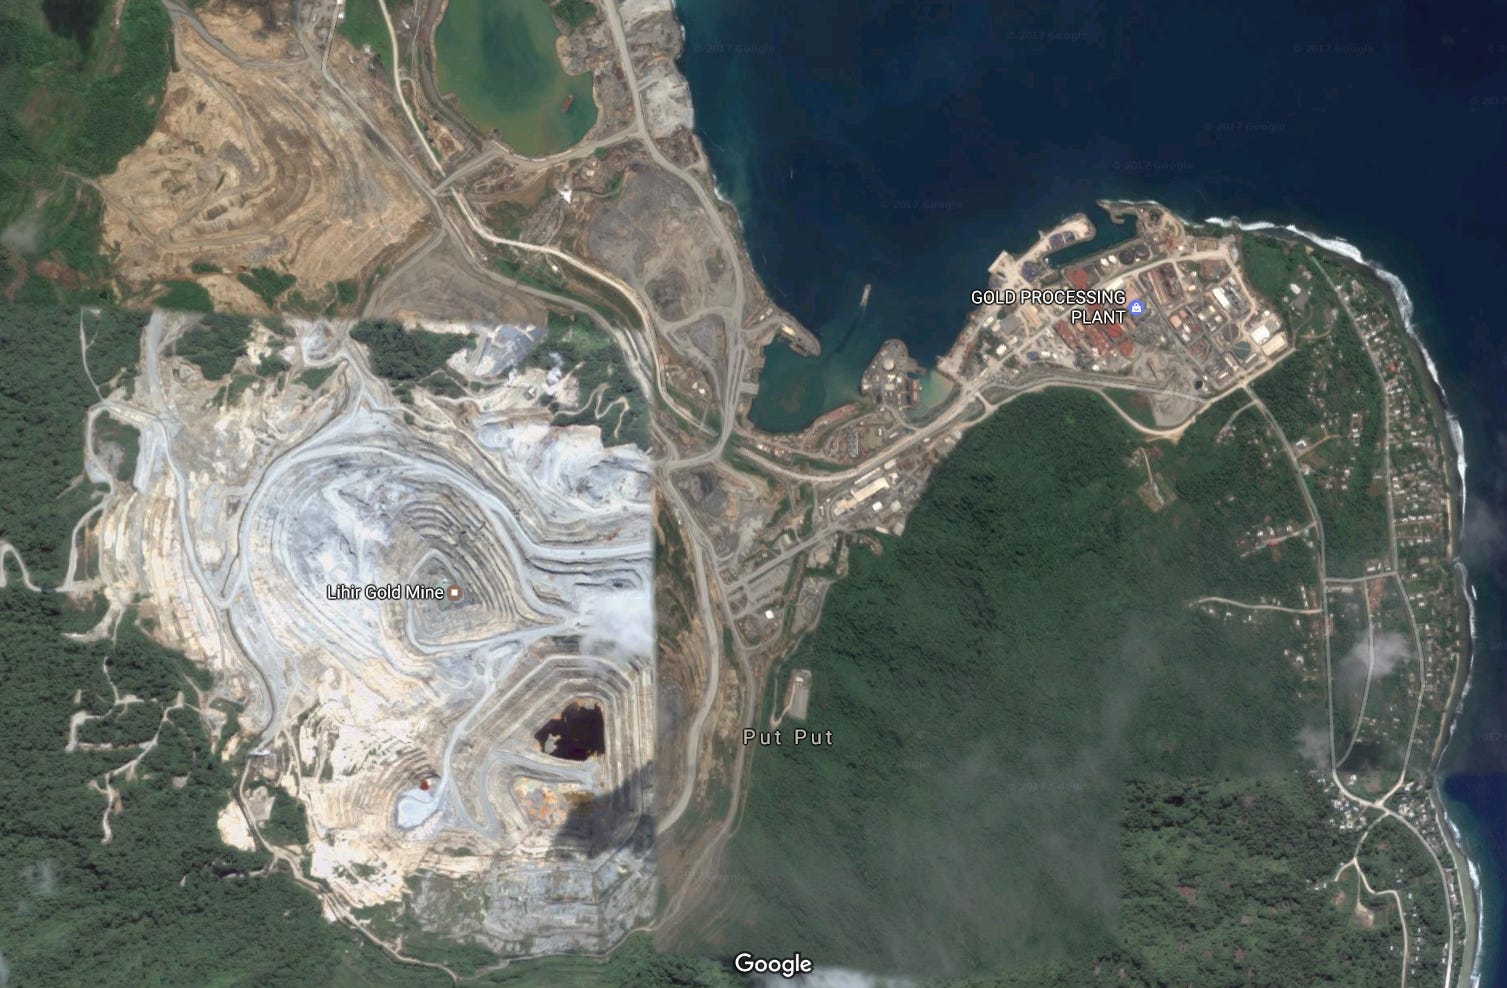
Look again. I guess we have to zoom in still more to that bare patch labelled Put Put.
Bingo! Welcome to the Lihir Mine, which in 2016 dug up 13 million tons of gold-bearing ore, from which it extracted 28 tons of gold. Slim pickings! The price of gold fluctuates a lot but was worth about $1,200 an ounce in 2016. That works out at $1,080 million gross. Alas, the mine spends about $900 extracting every ounce, so the net was only $300 million.
Most of the island’s 18,000 residents still live in huts scattered around the island’s coast. The mine employs 5,000 people, but a lot of them (which means I don’t know how many) are outsiders, brought in on salaries that the locals can hardly imagine. The locals have protested a lot in recent years. Which raises the question: who owns this hole in the ground? The answer is an Australian company called Newcrest. Its 2019 revenues were a bit less than $4 billion.
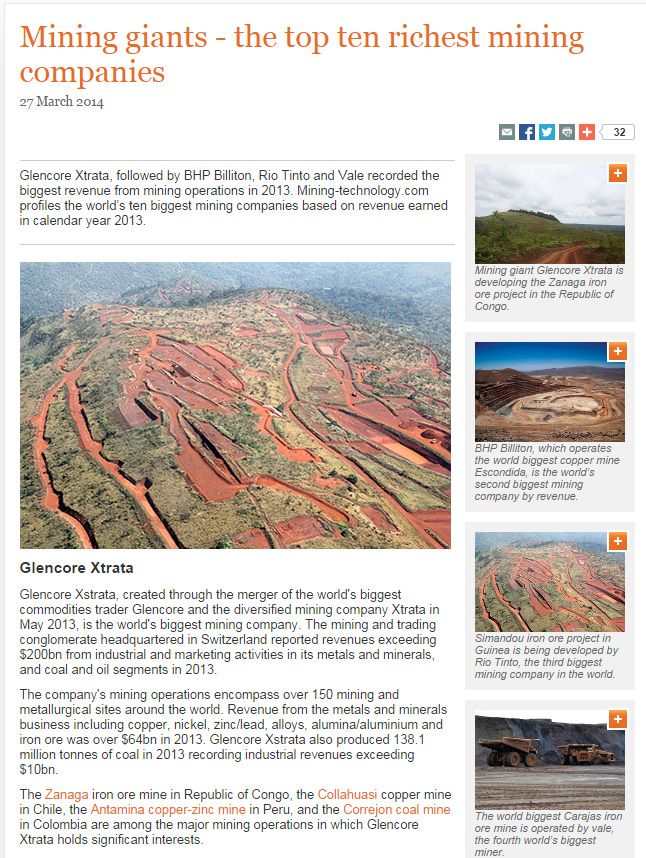
Sounds like a lot, but compared to the industry giants Newcrest is a shrimp. The top three are Glencore Xtrata, BHP, and Rio Tinto (the owner of Bingham Canyon). Glencore is by far the biggest, with revenues of $220 billion in 2019, versus $44 billion for BHP and $41 billion for Rio Tinto. Oddly, Glencore is a newcomer, a Swiss trading company that jumped into mining with its 2013 acquisition of Xstrata. (The name Glencore is an acronym for Global Energy Commodity Resources, a name only investors could love.)
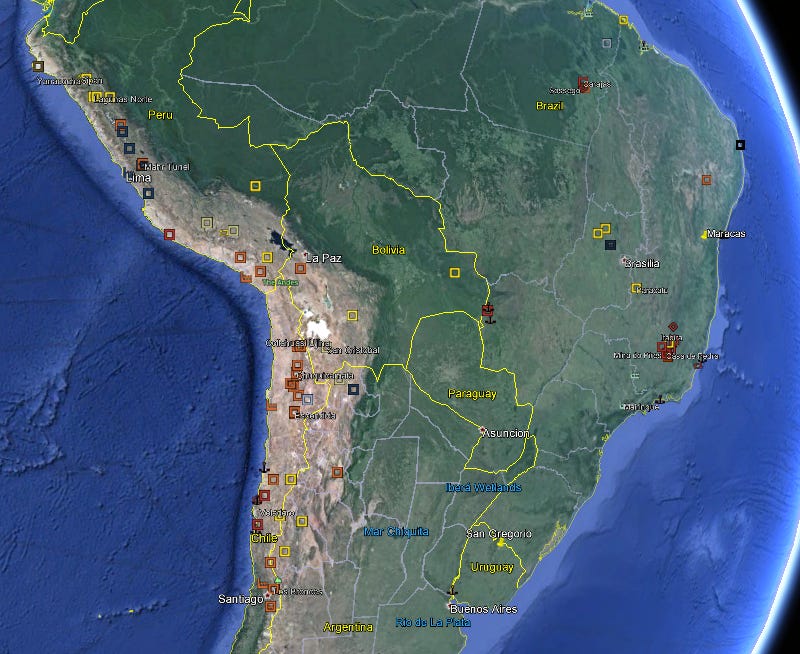
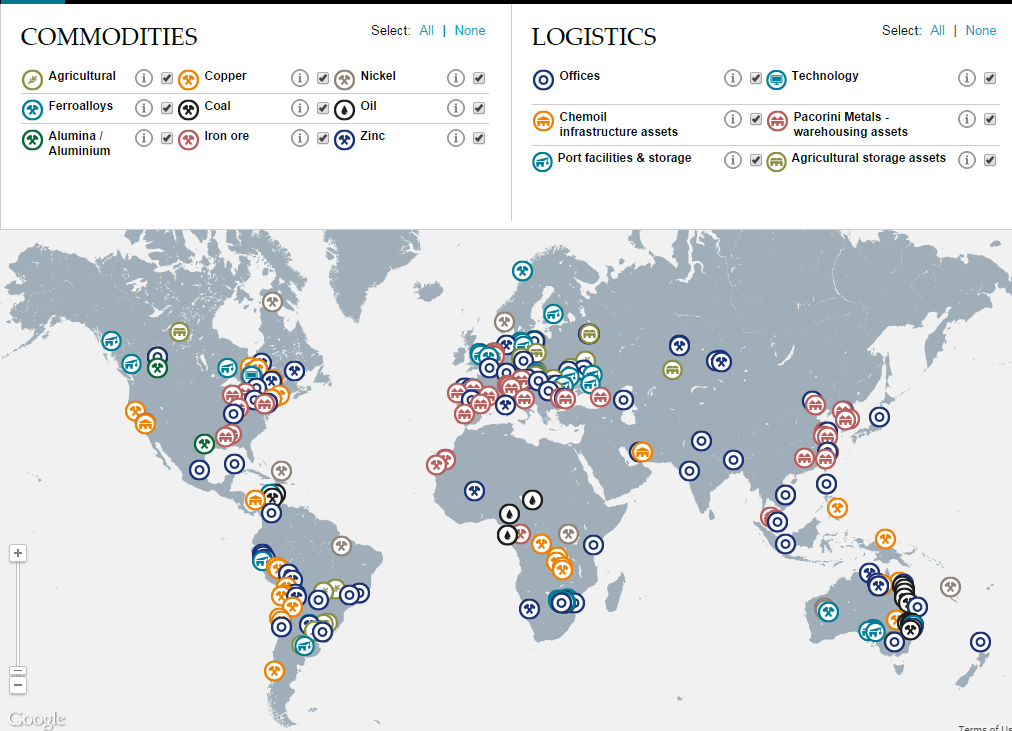
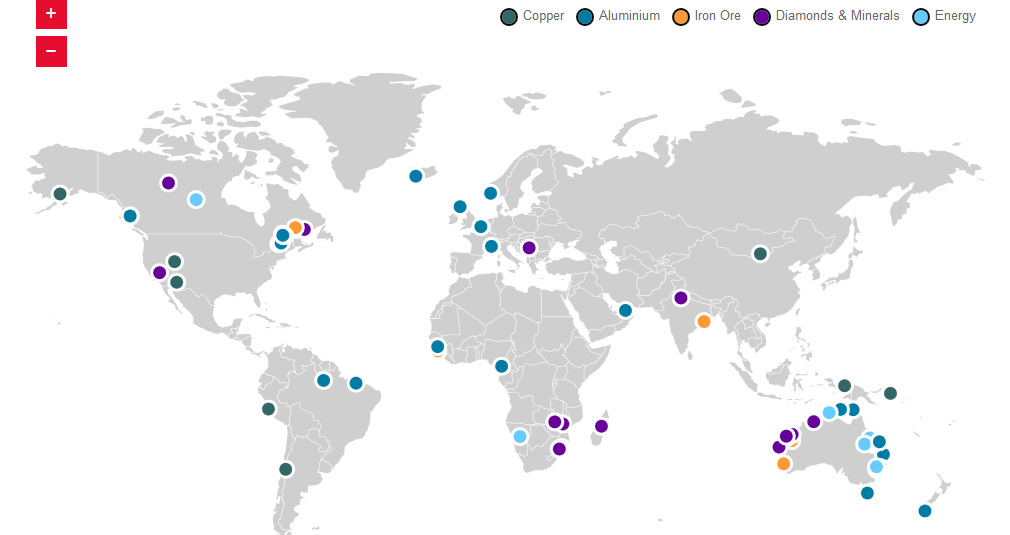
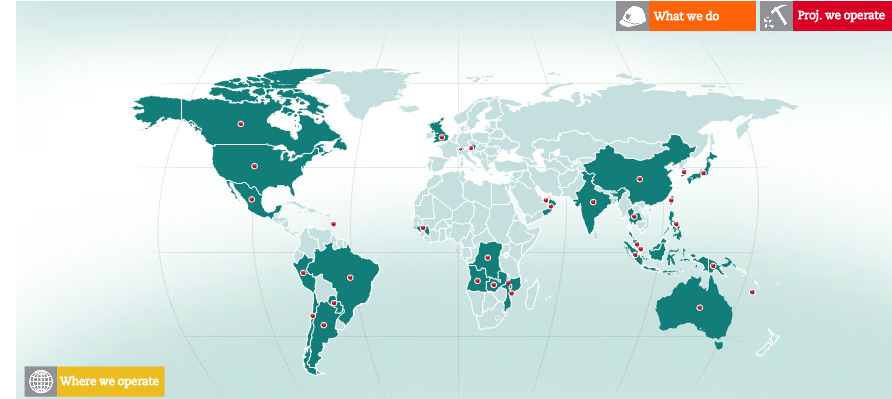
Here's a map of Glencore's operations. How’s that for a global footprint? See the orange for copper? It pops up in the places we saw earlier, especially the American Southwest, Chile, and the Copperbelt.
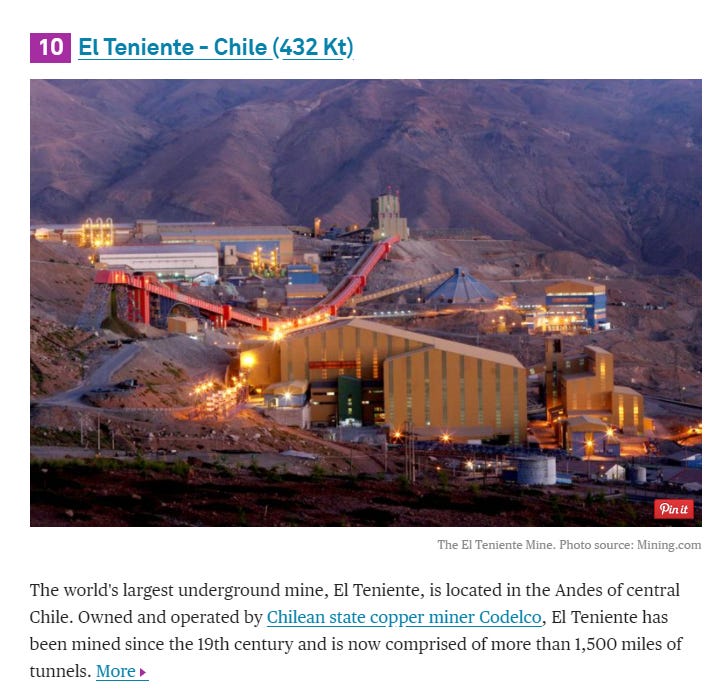
The three biggest Chilean mines are largely owned by companies we’ve already bumped into. Escondida (“The Hidden”), for example, is mostly owned by BHP and Rio Tinto. The chief exception is El Teniente (“The Lieutenant”), at the bottom here. It’s owned by Codelco, Chile’s national copper company, formed in 1971 by nationalizing all the private mines at that date. (Escondida was discovered later.)
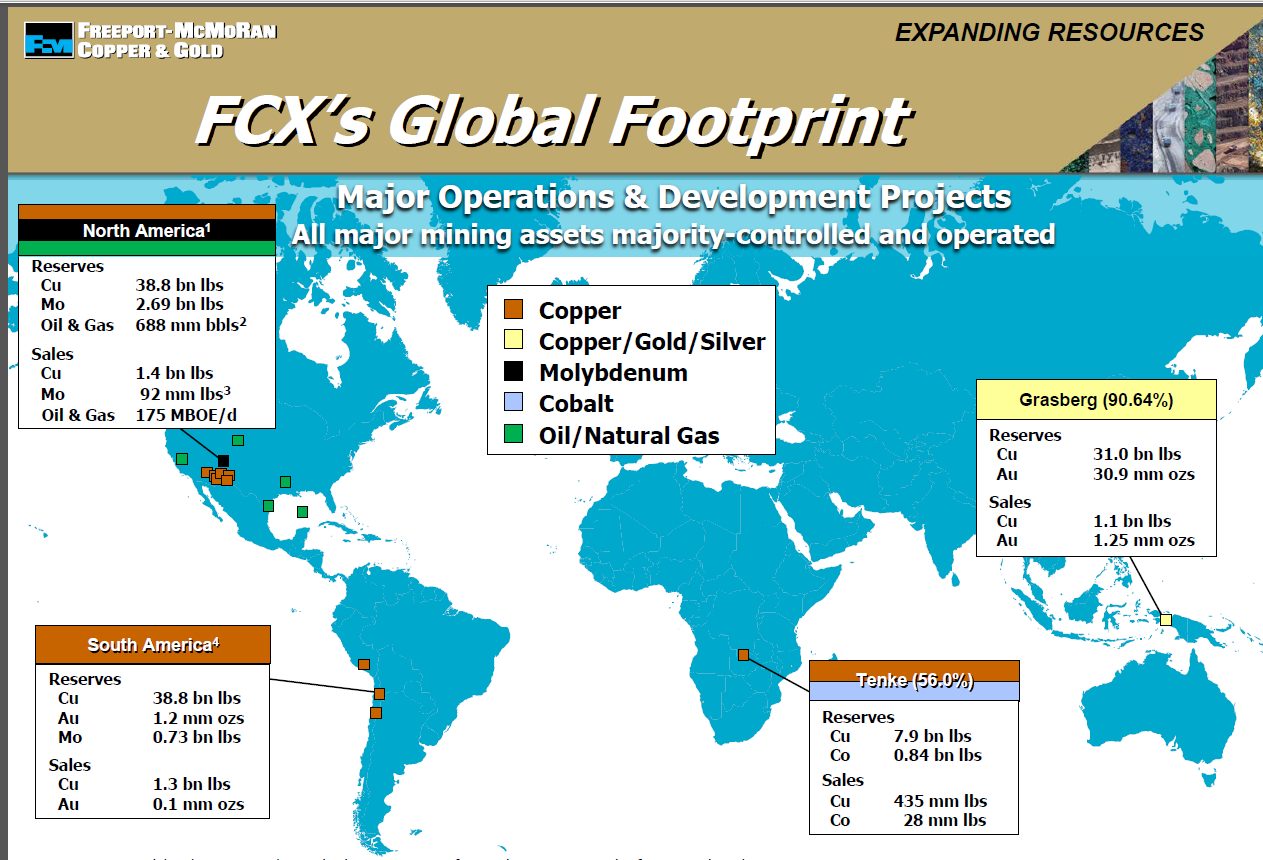
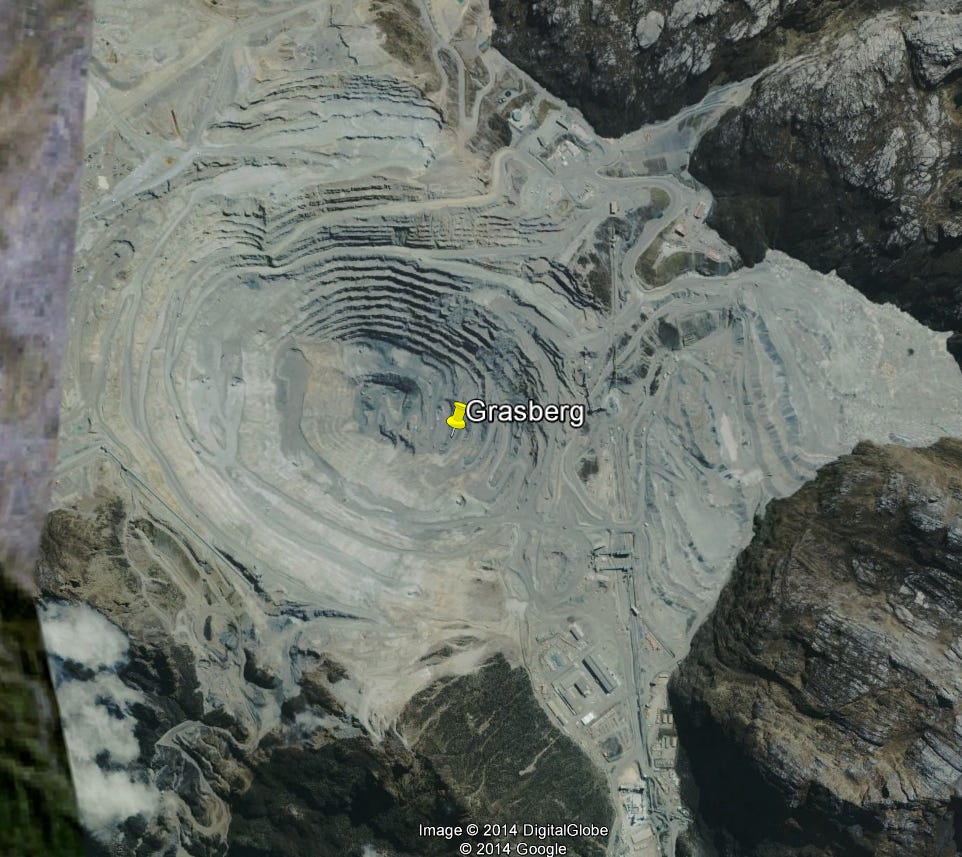
The biggest copper producing company, rather than country, is Freeport-McMoRan of the US. It gets a billion pounds of copper annually from the U.S., another billion from South America, another billion from the Grasberg Mine in Indonesia, and about half a billion from the Tenke Mine in the DRC’s Copperbelt.
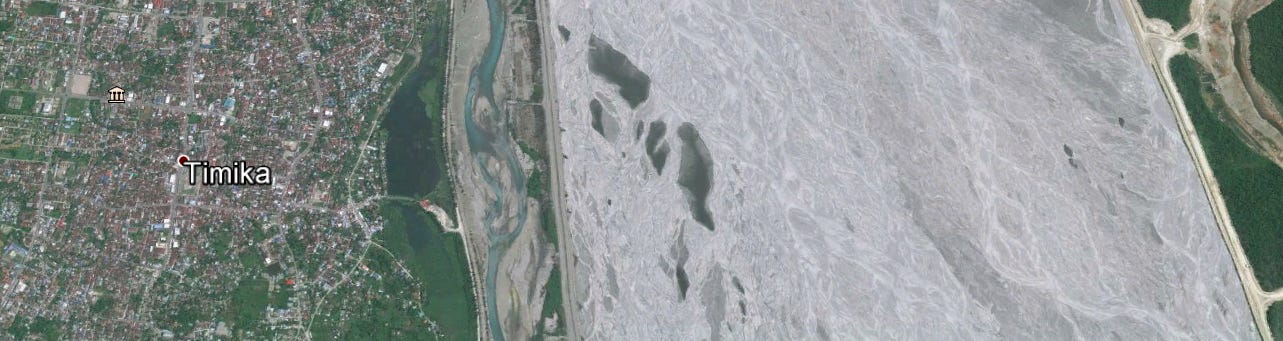
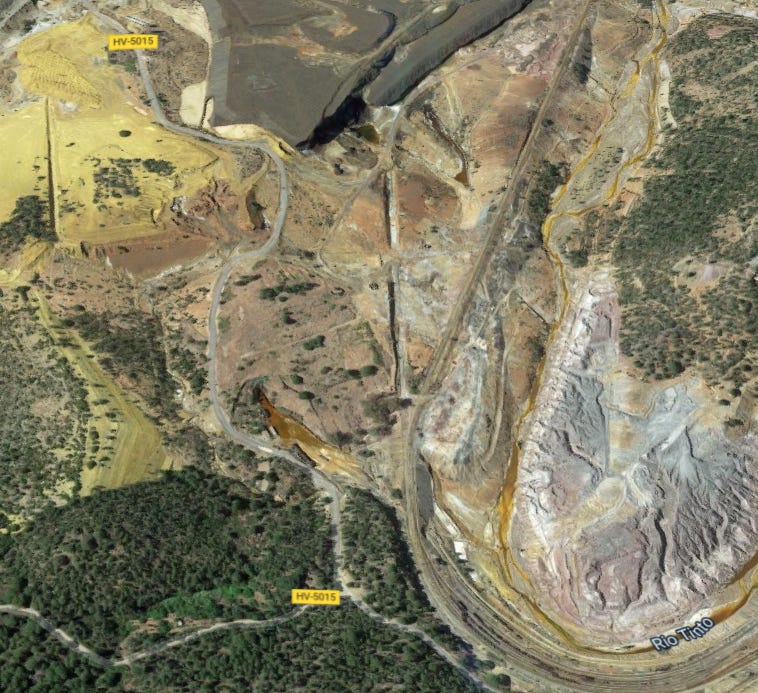
If you go looking downstream, you'll see a real mess of waste rock choking a river.
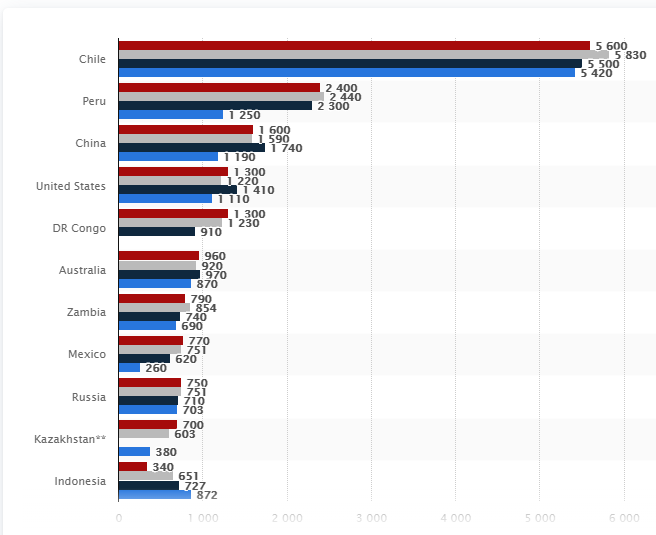
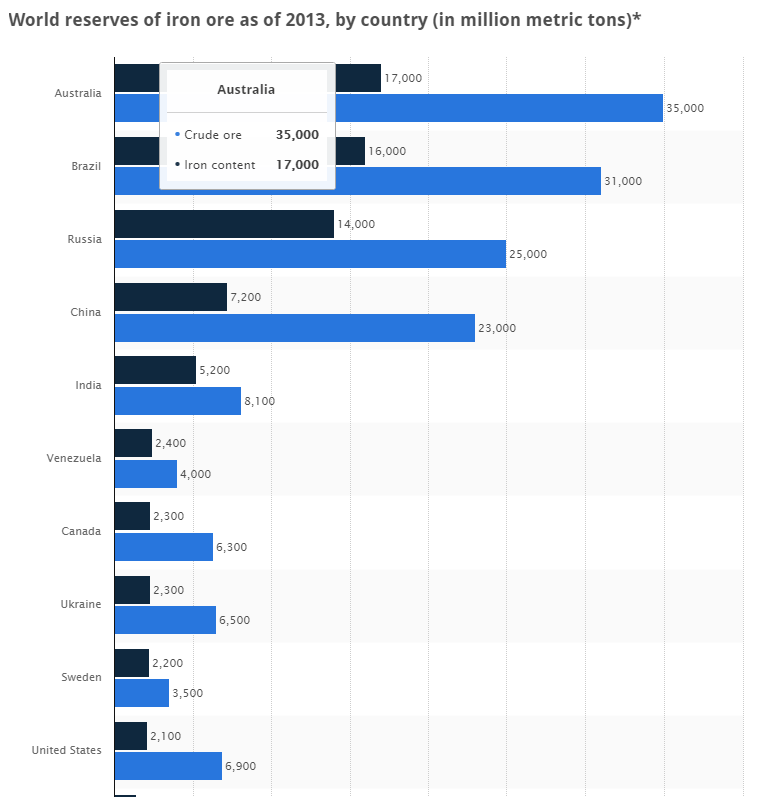
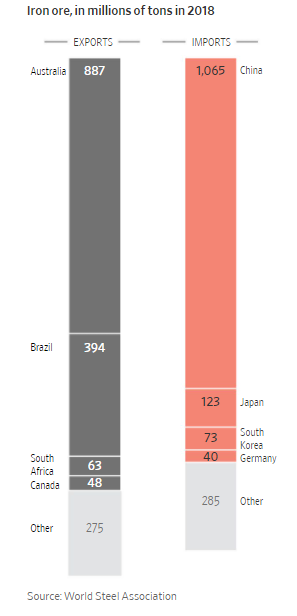
The 18 million tons of copper produced annually worldwide seems like a lot, but it's trivial compared to 6he billion-plus tons of iron produced annually. Here are the countries that have the most iron ore. Notice the U.S. down at the bottom.
(An easy to overlook fact: copper mines often produce an ore that is only one percent copper. Escondida’s ore, for example, is only about .8 percent copper. Australian iron ore, on the other hand, is about 50 percent iron. All the ores below are at least one-third iron.)
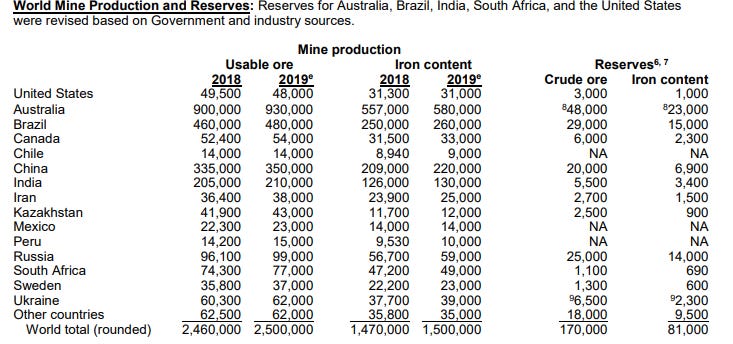
The major iron-ore producers are Australia, Brazil, China, and India. The first two cannot use everything they mine; they mostly export ore to China, which produced a lot of iron ore but not enough for its domestic requirements.
Despite China's third-place ranking as an iron-ore producer, it is also the world's biggest importer of iron ore. As you might guess, that ore comes chiefly from Australia and Brazil.
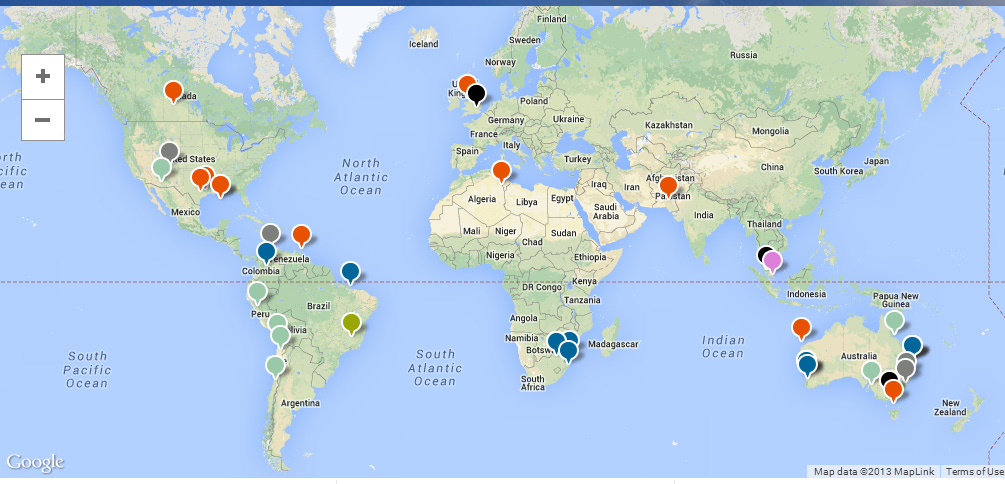
There are three big companies supplying that ore. Here’s a map of one of them, BHP, which has major operations around the world with the prominent exceptions of Russia, China, and India. (The name BHP comes from Broken Hill Proprietary, a fabulously rich mine in the town of Broken Hill, Australia. The company quit mining there in 1939, but small fry keep digging, nowadays for zinc and lead instead of for the silver that made some people rich.)
Here’s the third big iron-ore exporter. It’s Vale (pronounced differently in the U.S. than at home in Brazil). The company is involved in the slow development of perhaps the world’s biggest undeveloped iron ore deposit, at Simandou, in Guinea. Problem is, getting Simandou into production would cost about $20 billion, including the cost of a 400-mile railroad and port.
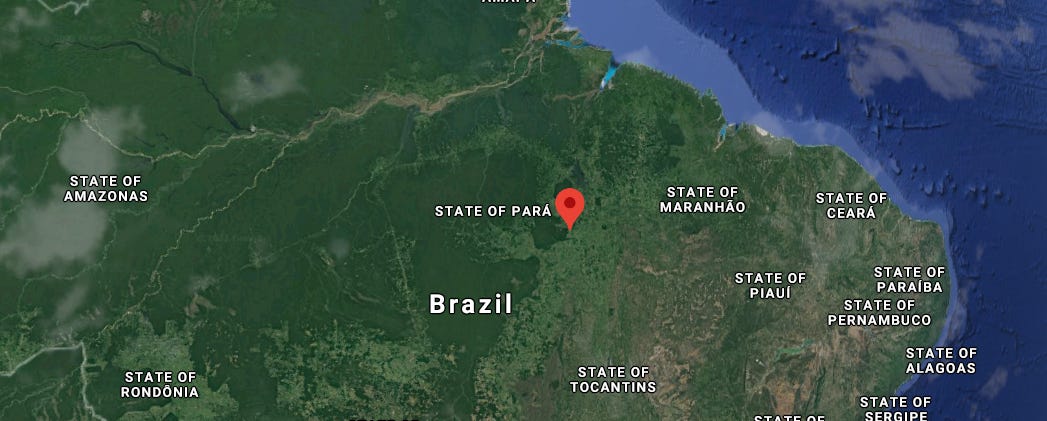
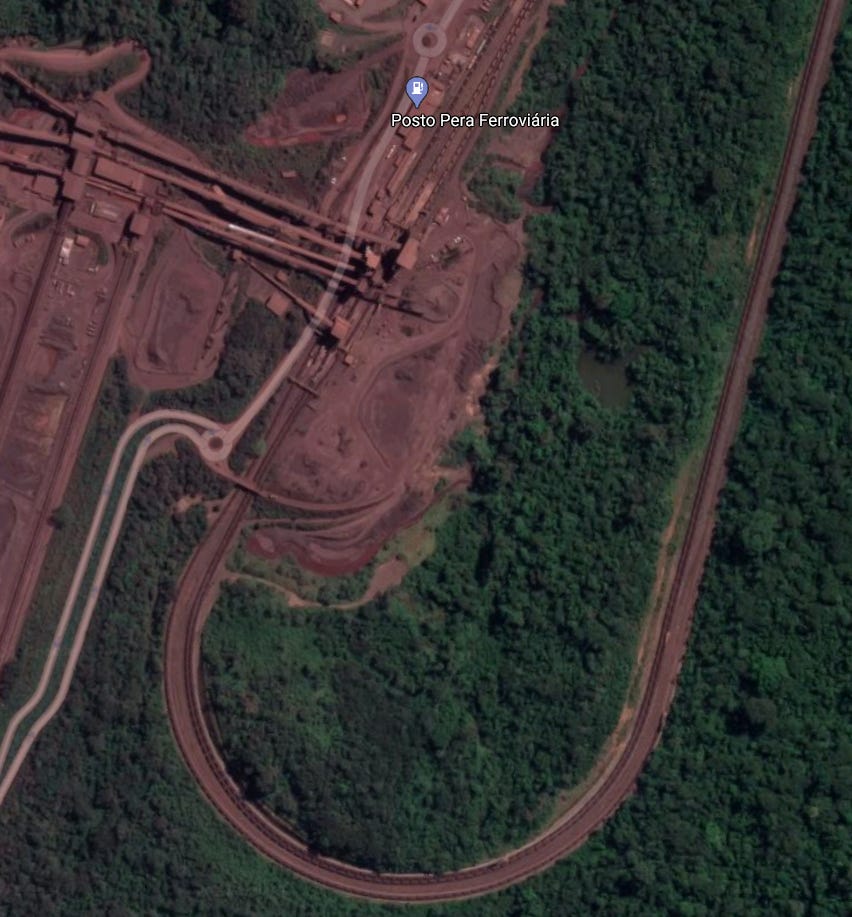
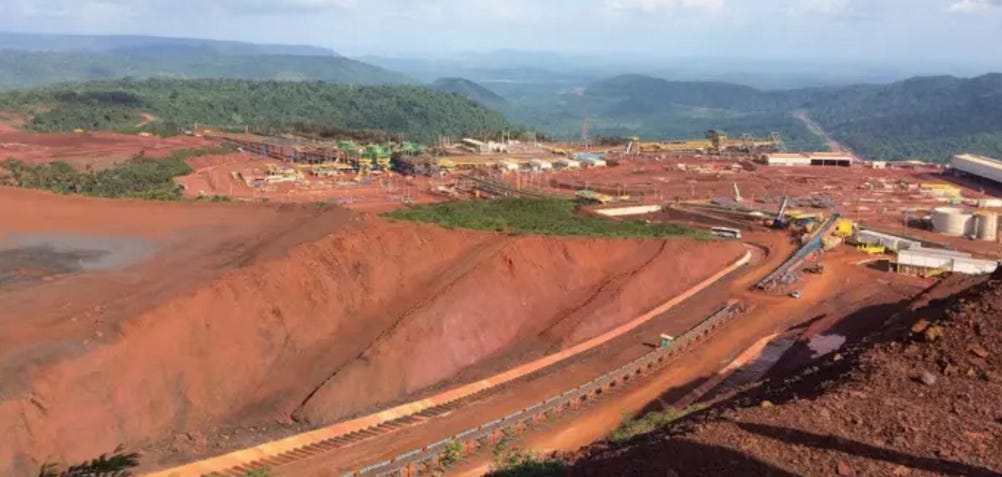
What does a modern iron-ore mine look like? Head west from Parauapebas, in the Brazilian state of Pará. Continue past the airport and Vale’s tightly organized company town of Carajás. Here’s the mine, about five miles across. The loop at the center-top is where ore is loaded onto railroad cars.
Like this.
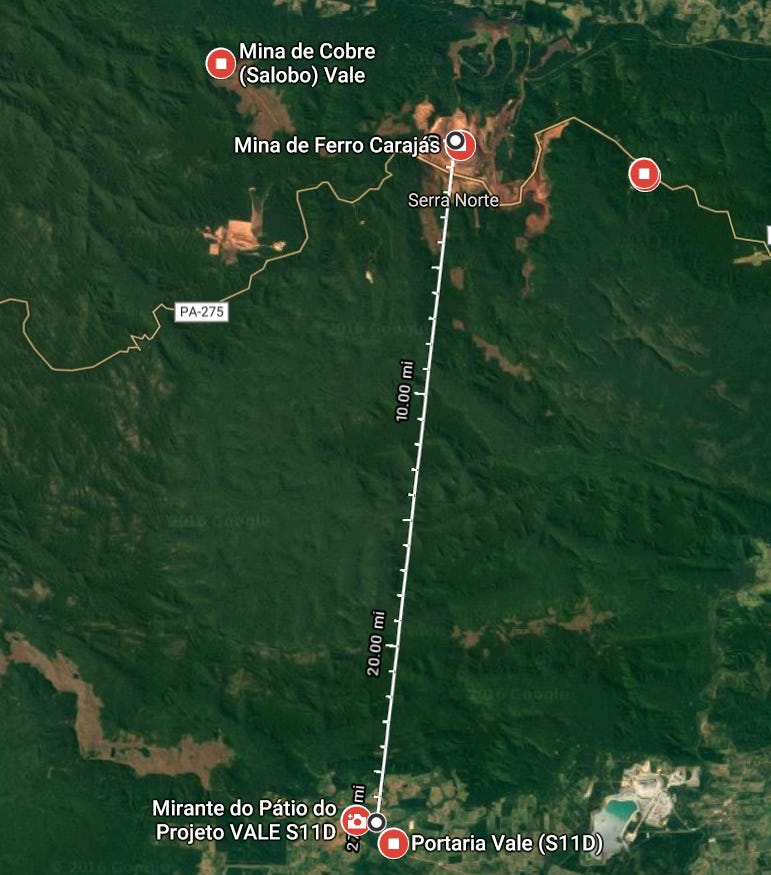
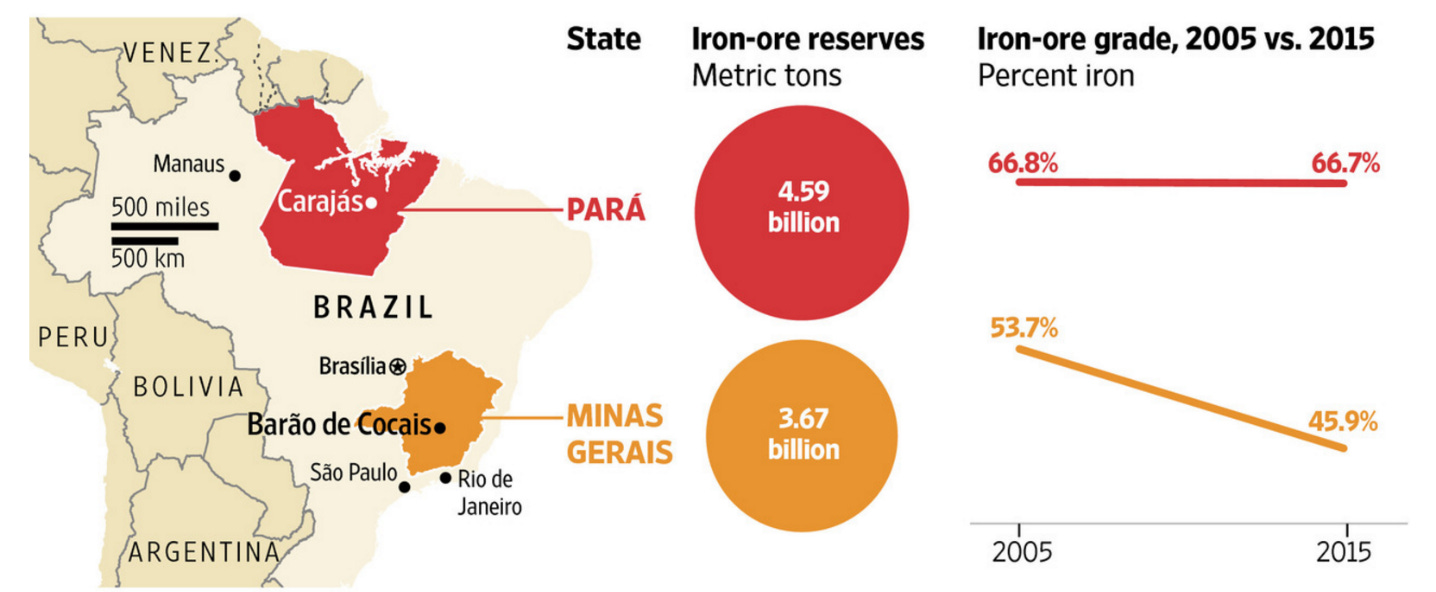
There’s lots more iron ore nearby. Less than 30 miles to the south, a $14 billion mine opened in 2016. Vale predicts it will be in operation for a century. Its name is very unromantic—S11D—but there was plenty of excitement during its development, because the world price of iron ore was $191 a ton in 2011, when development began. Five years later, as the mine was close to opening, the price was $37 a ton. Sounds disastrous, but the company’s cost of digging the ore and getting it by rail to the coast is less than $8 a ton.
Ore from here is so cheap that Vale is gradually shifting operations from older mines in the state of Minas Gerais (“General Mines” in Portuguese) to Pará State, which includes Carajás and S11d.
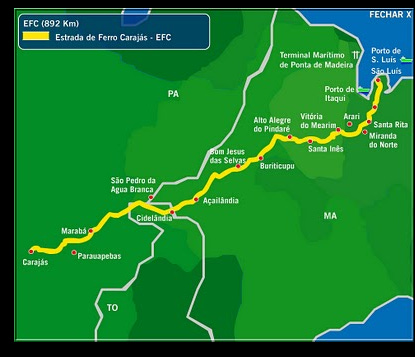
The ore is shipped by the EFC (Estrada de Ferro Carajás) railroad to the coastal town of São Luis. Before S11D opened, trains were already carrying about a million tons of ore daily. The EFC also carries about 1,300 passengers daily.
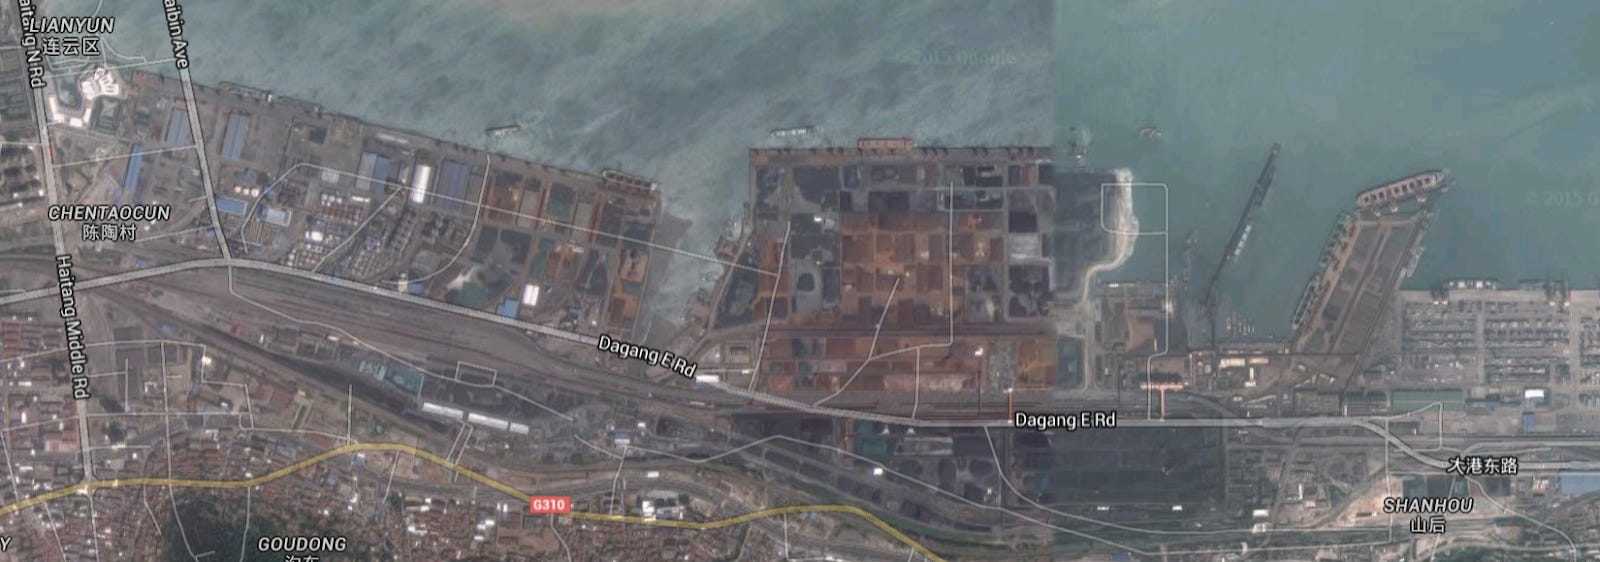
The other end of the voyage looks like this: it’s Lianyungang, a major Chinese port about halfway between Beijing and Shanghai.
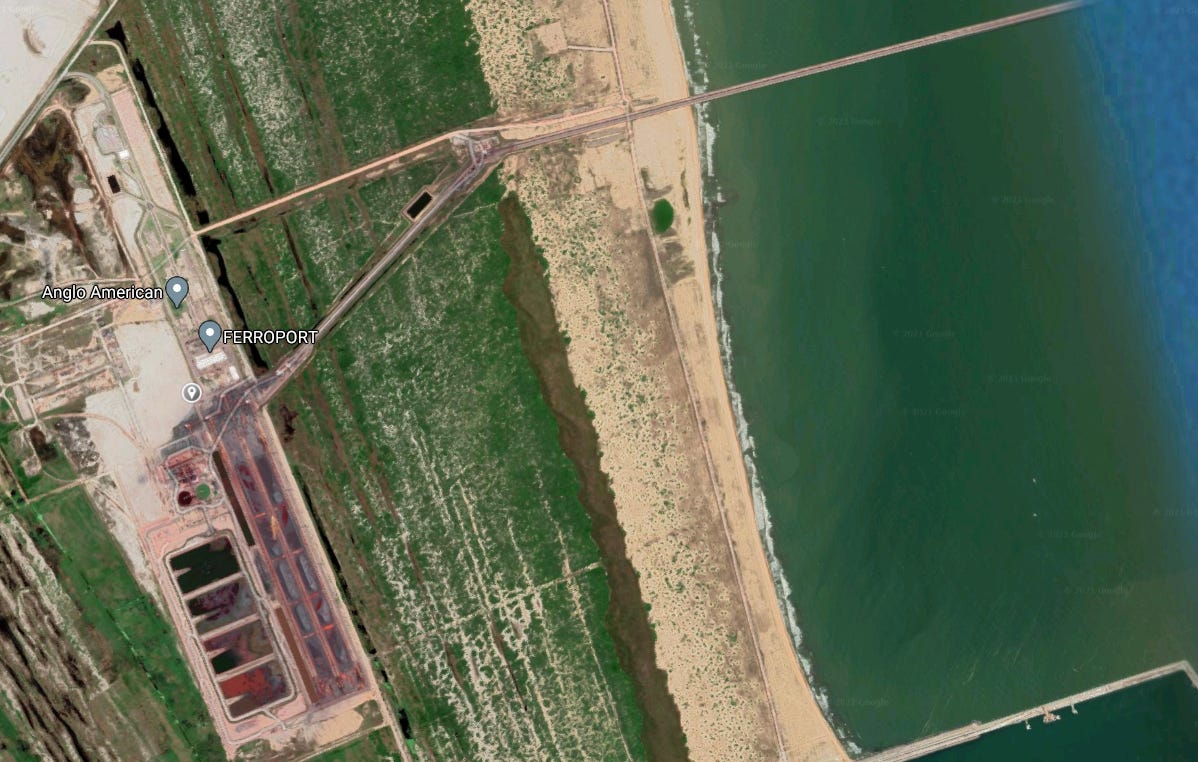
In 2014, AngloAmerican, a mining company based in South Africa, opened a Brazilian iron-ore mine and began shipping ore 530 kilometers by pipeline to the port at Acu. Sounds weird? The finely-ground ore is suspended in water.
You can see the ridge of ore they'll be mining.
And here's the port (still under development) where it will go. It's about 20 miles southeast of the town of Campos.
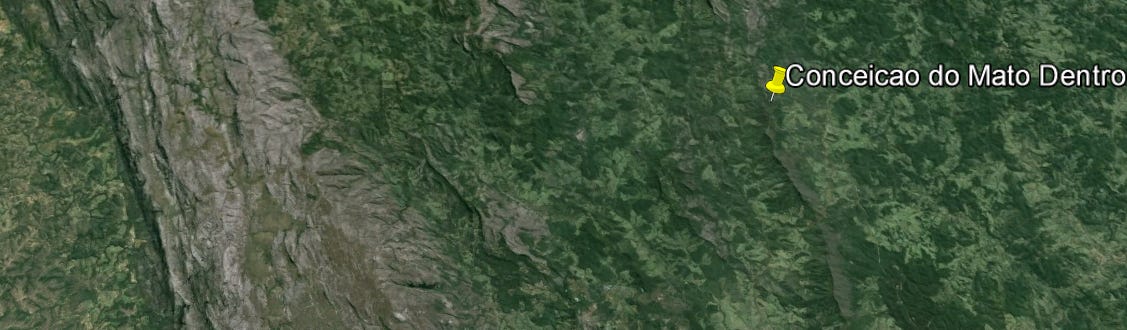
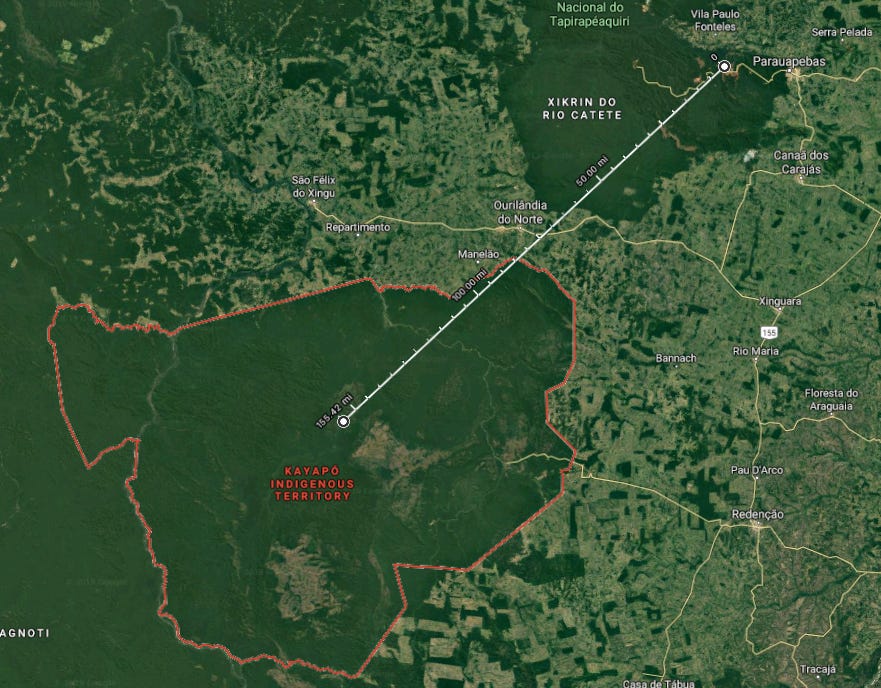
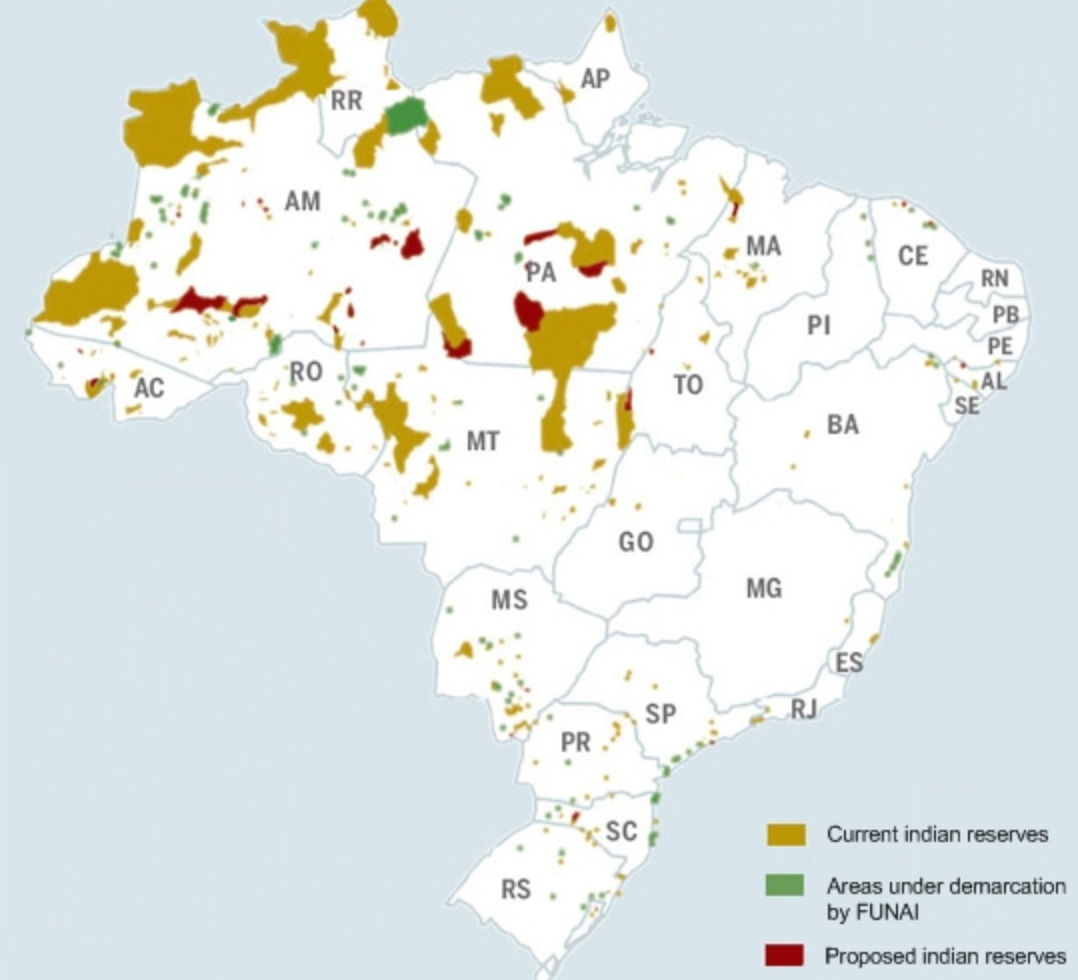
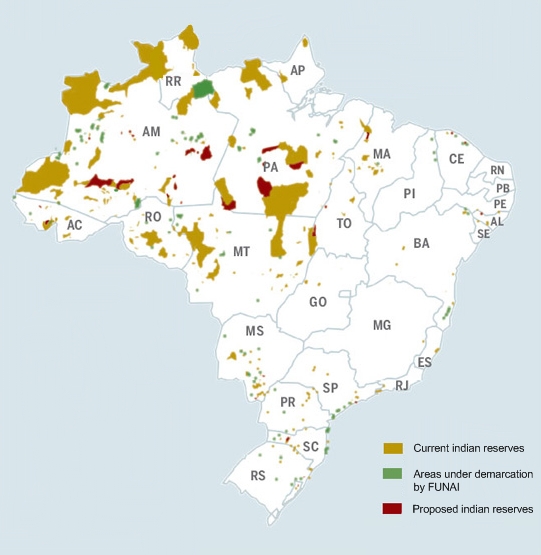
I’m going to take a short detour. The ruler below stretches about 150 miles from the Carajás mine down to the center of the Kayapo Indigenous Territory.
The Kayapo reserve is one of Brazil’s largest, covering over 12,000 square miles (Massachusetts is less than 8,000) divided between Pará (PA) and Mato Grosso (MT) states.
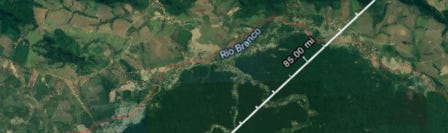
I’ve come up to the top of the reserve to show how the boundary (in red) coincides closely with the Rio Branco and with the shift from forest to farmed land. See that creek reaching deeper into the forest?
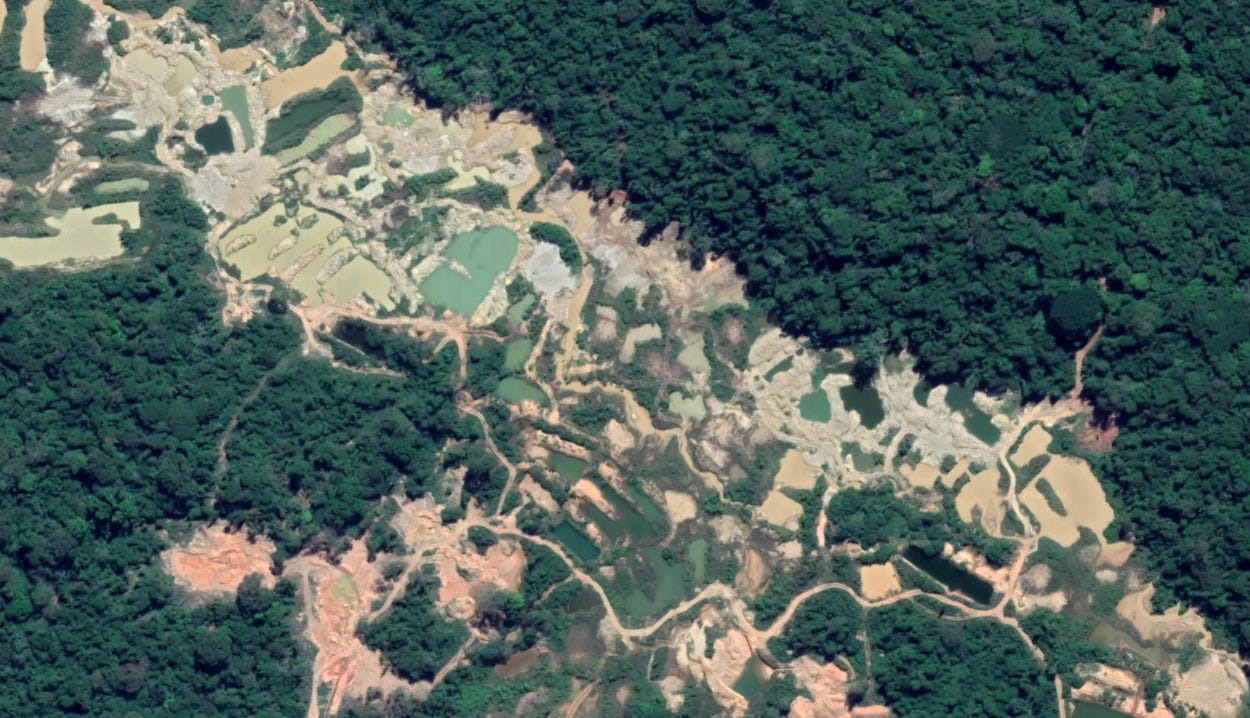
Welcome to Brazil’s gold rush, in the hands not of multinational companies but of garimpeiros, subsistence miners eking our a few dollars worth of gold daily.
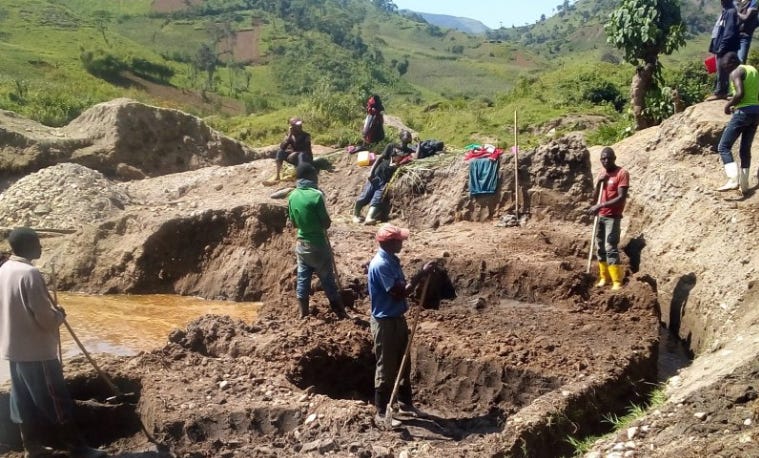
Such “artisanal miners,” as they are politely termed, operate in many parts of the world. That’s the way the old gold rushes of California and Canada’s Yukon operated, of course. Today, solo prospectors still scramble not only in Brazil but also in Africa. You don’t have to look far to find dramatic images of this stuff. Here are three from Africa.
At least the miners in the previous two pictures could keep their feet more or less dry. No luck here in Luhihi, in the DRC immediately west of Lake Kivu. As the URL suggests, the people making the most money here are the service providers, not the miners. Same as in the California gold rush of 1849.
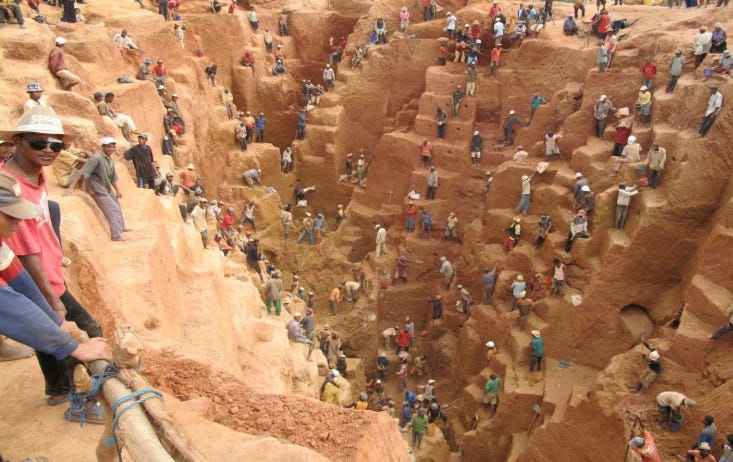
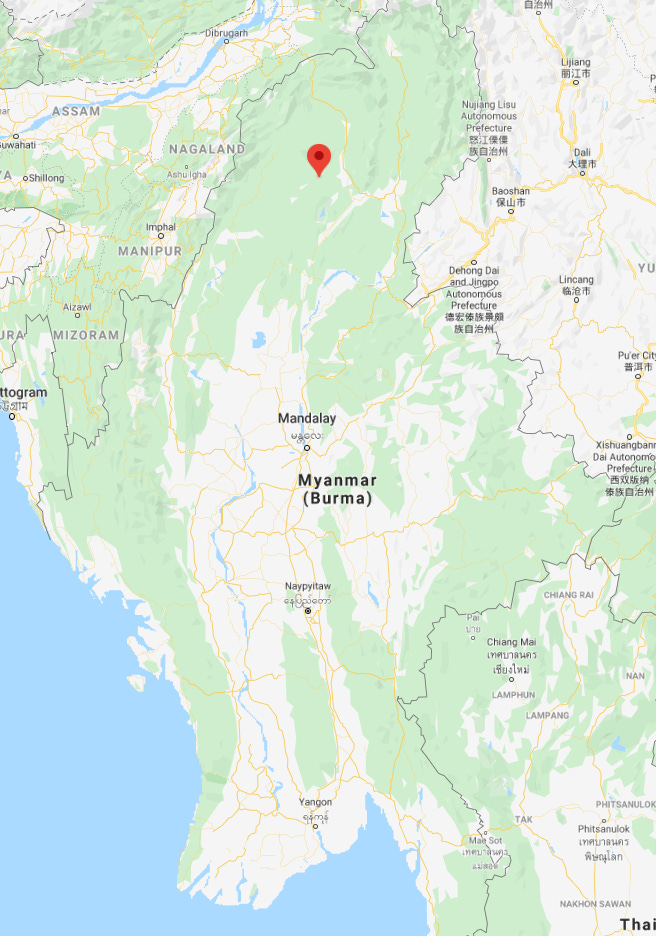
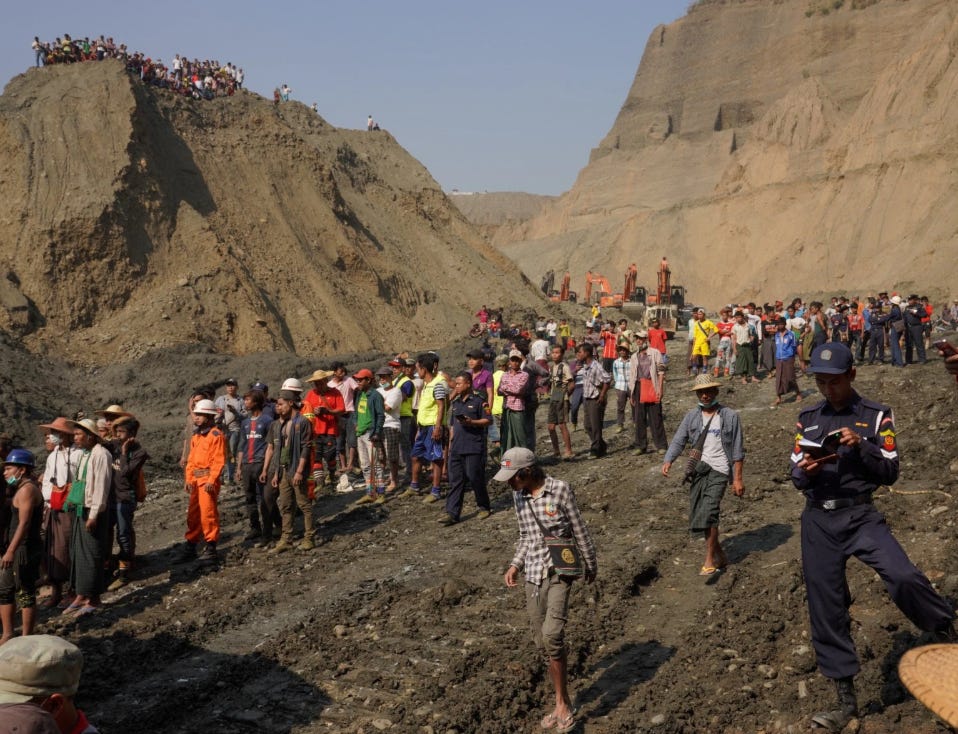
Another example of artisanal mining. The world’s most valuable jade (jadeite) is mined primarily along the Uyu River near Hpakent (or Phakent) in northern Burma. It’s 250 miles north of Mandalay in very remote, rugged and heavily forested territory.
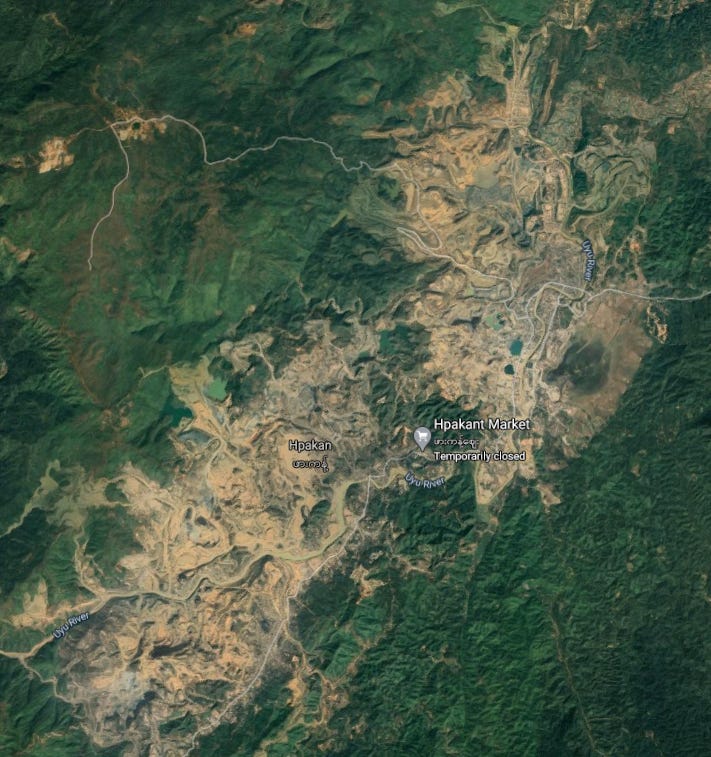
Here’s a large (but not the only) part of the mined area.
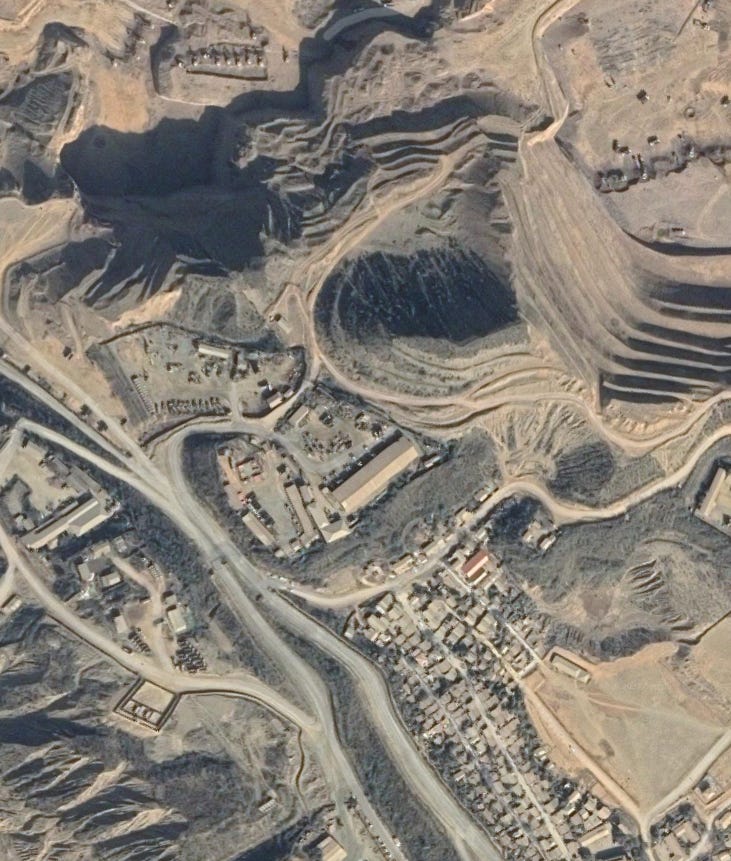
A close-up. These mines are controlled by either the military or by the Kachin Independent Army, and they employ about 100,000 people despite grave danger from landslides and floods.
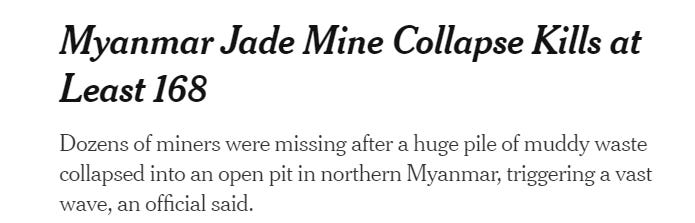
Here’s a photo from the aftermath of a landslide in 2019 that killed about fifty people.
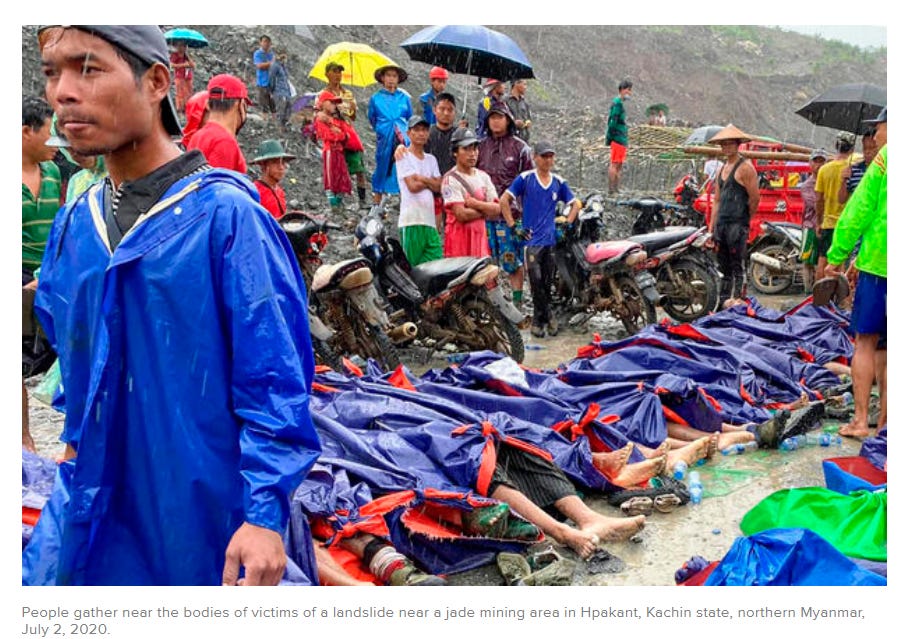
Such scenes make big, mechanized mines look good. Here’s Mt. Whaleback, an iron-ore mine owned by BHP near the town of Western Australia town of Newman. No garimpeiros here.
There are lots of other big iron-ore mines in the neighborhood. They’re marked in yellow on this map, which also shows the railroads that carry the ore to the ports from which it’s shipped.
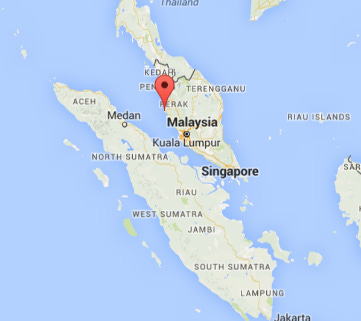
Australia has a big advantage over Brazil because it’s so much closer to China. What can the Brazilians do to minimize their disadvantage? Here’s one idea: it’s a terminal on the west coast of Malaysia. Huge ships from Brazil sail east across the Atlantic and Indian oceans, then unload here. You can see five piles of ore of different grades that can be mixed to meet buyer requirements. Then the ore is loaded on smaller carriers and shipped the rest of the way to China.
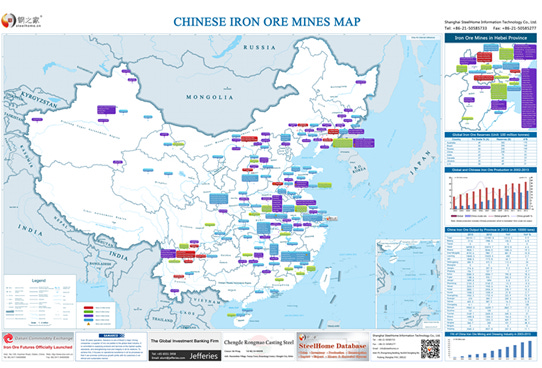
Chinese ore, which I’ve almost forgotten, is produced very widely across the country. The largest blank area appears to be Tibet, though in fact there are large deposits there, and the Chinese will begin to work them once they complete the railroad network they've planned.
The biggest problem the industry faces is probably that Australia and Brazil produce ore more cheaply than China. When iron-ore prices fall, it’s the Chinese producers who shut down first.
Another historical detour: Here’s world iron-ore production in 1913, shown in red. The height of the bar indicates percentage of world production. The figures are illegible here but they show that the U.S. produced 36 percent of the world total, followed by 12 percent for France and nine percent for the UK.
Brazil doesn’t appear at all; neither do Australia or China.
(Blue is manganese, dominated by Russia at 56 percent. Green is chromite, the source of chrome. South Africa leads at 37 percent.)
From the World Atlas of Commercial Geology, published by the USGS in 1921.
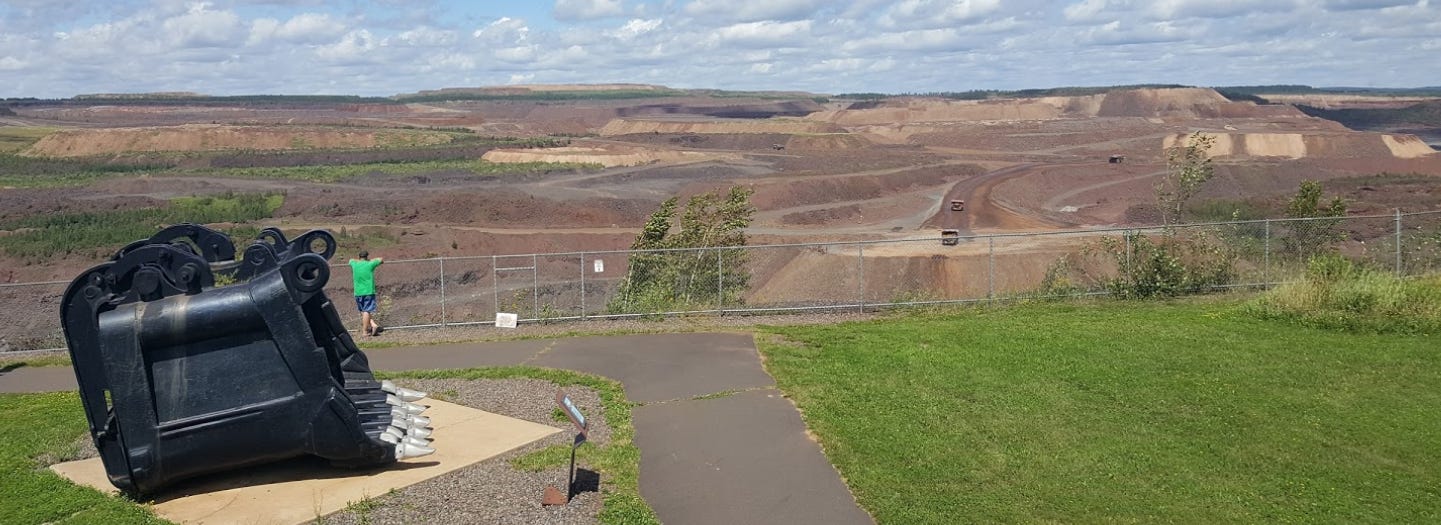
The ore came largely from Minnesota’s Mesabi Range, where a line of open-pit mines stretched about 60 miles. It’s still active, but at much lower production rate.
The green blocks point to active mining areas as of 2019.
The biggest mine in the Mesabi Range was the Hibbing Pit, technically the Hull-Rust-Mahoning Open Pit Iron Mine. During World Wars I and II, the mine was at its peak and produced about a quarter of all the ore produced in the U.S. A bunch of smaller mines now work within the Hibbing Pit. Together, they produce eight million tons annually, about a week’s production at Carajás.
The town of Hibbing used to be two miles farther north; it moved south about 1920 to make
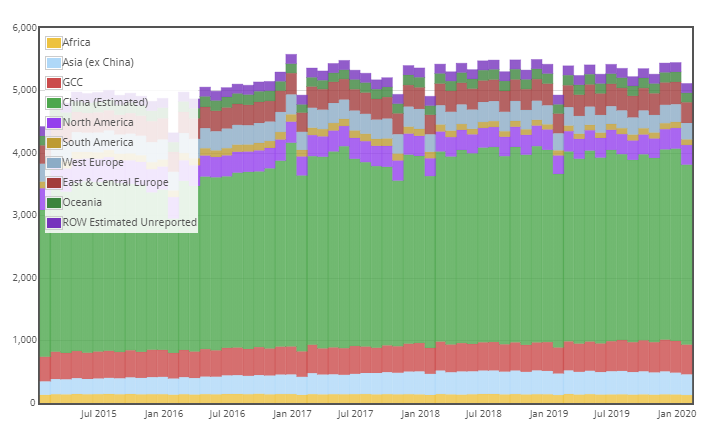
We turn now to aluminum, produced from a clay called bauxite. The world produced about 370 million tons of bauxite in 2019, which is processed into about 60 million tons of aluminum. Notice China’s rapid growth, in yellow.
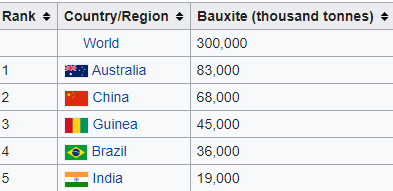
Who has the bauxite? Not China, at least not in proportion to its consumption. Between them, tiny Guinea and big Australia have almost half the world total. Add Brazil and Vietnam and you've got almost two-thirds of the total. Why in these places? Bauxite is formed by the weathering of soil until almost all the minerals except aluminum oxide have been leached. Such clays are found widely in the tropics, where heat and moisture weather soils deeply.
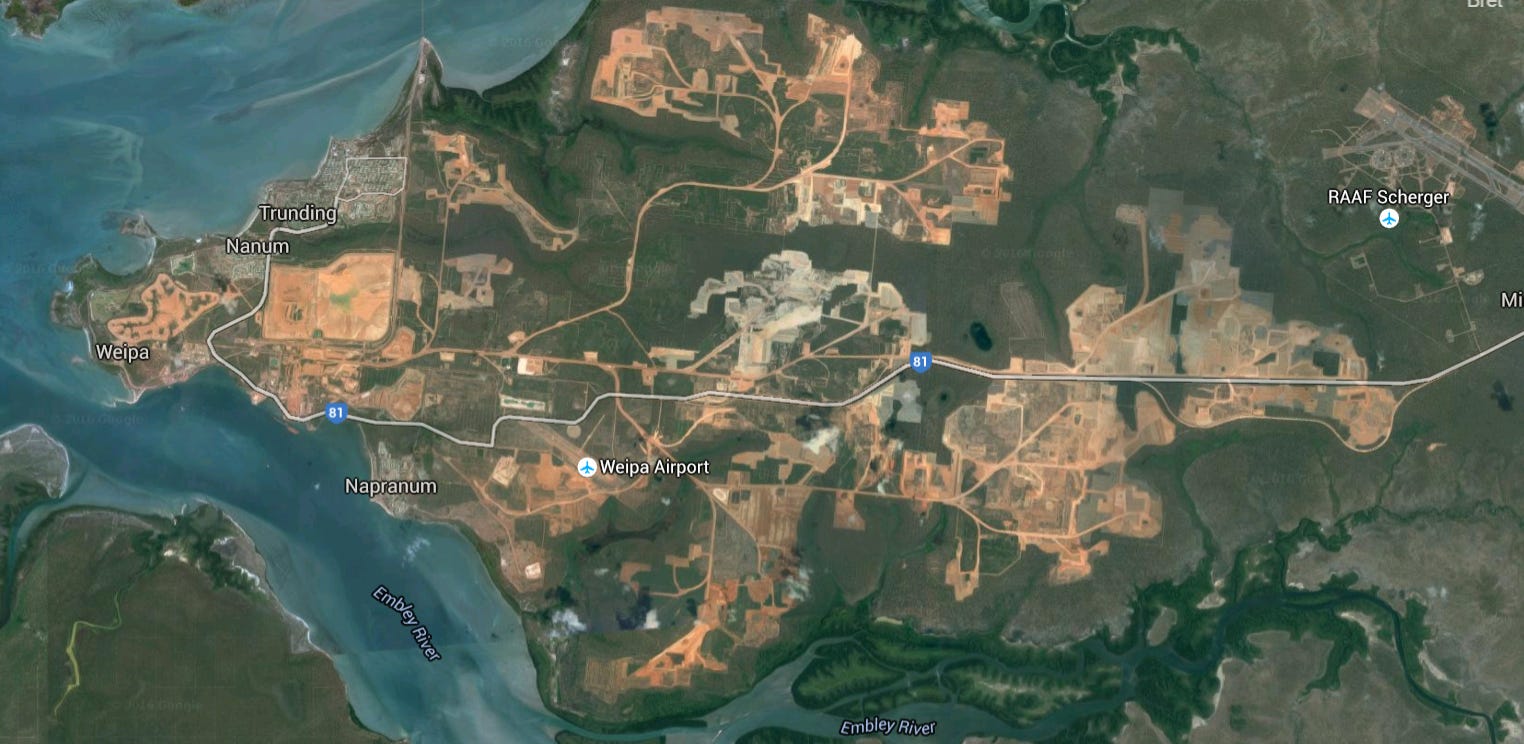
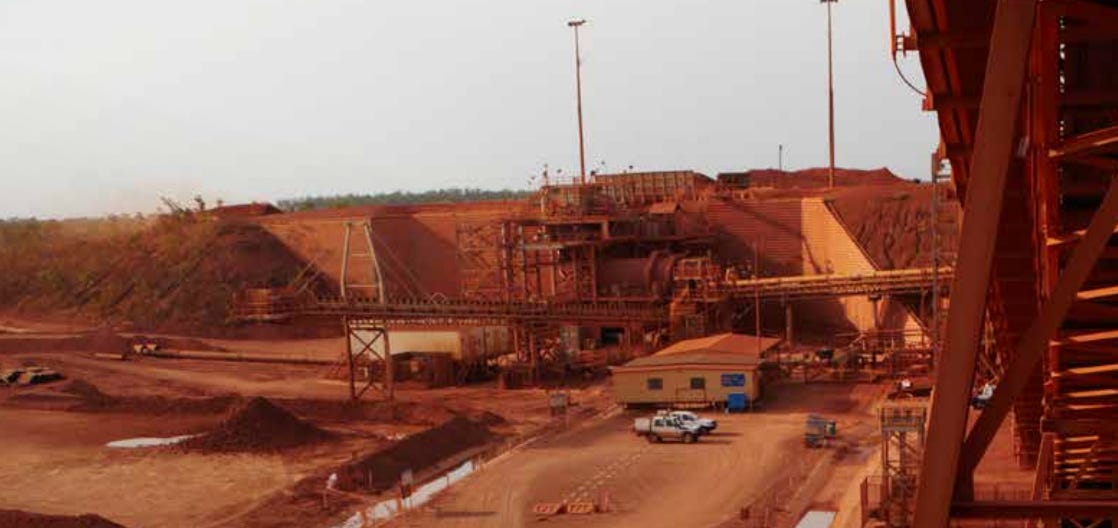
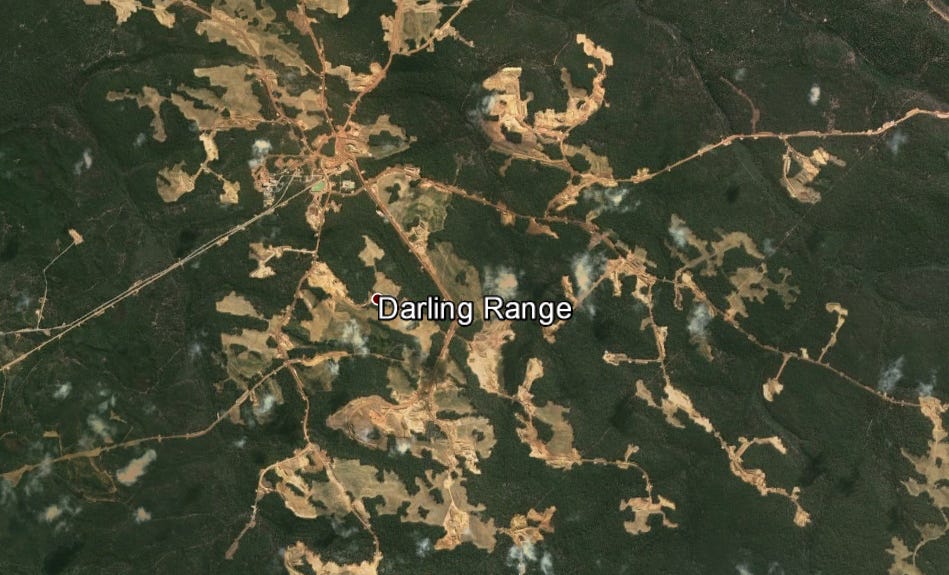
Australia’s most important bauxite-production areas are in the SW, near Perth, and in the NE, on the Cape York Peninsula. In the southwest, the Huntly and Willowdale mines are operated by Alcoa. (That’s an acronym for Aluminum Company of America, though the company’s legal name is now just Alcoa). The two mines produce over 34 million tons of bauxite annually. In the northeast, Rio Tinto operates the mines at Weipa, which produce about 23 million tons of bauxite annually. Between them, these three mines annually produce well over half of Australia’s 81,000,000 tons of bauxite.
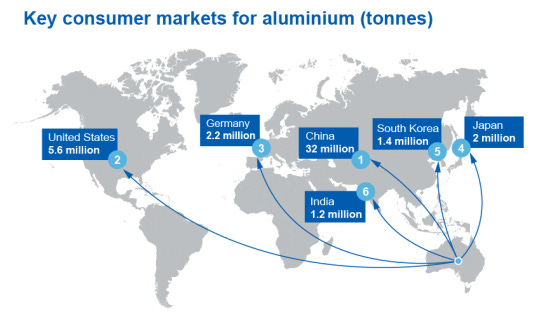
Almost all of Australia's production is refined in Australia to alumina (aluminum oxide), which is then exported for smelting to make aluminum metal. China, as you should expect, is the big alumina buyer.
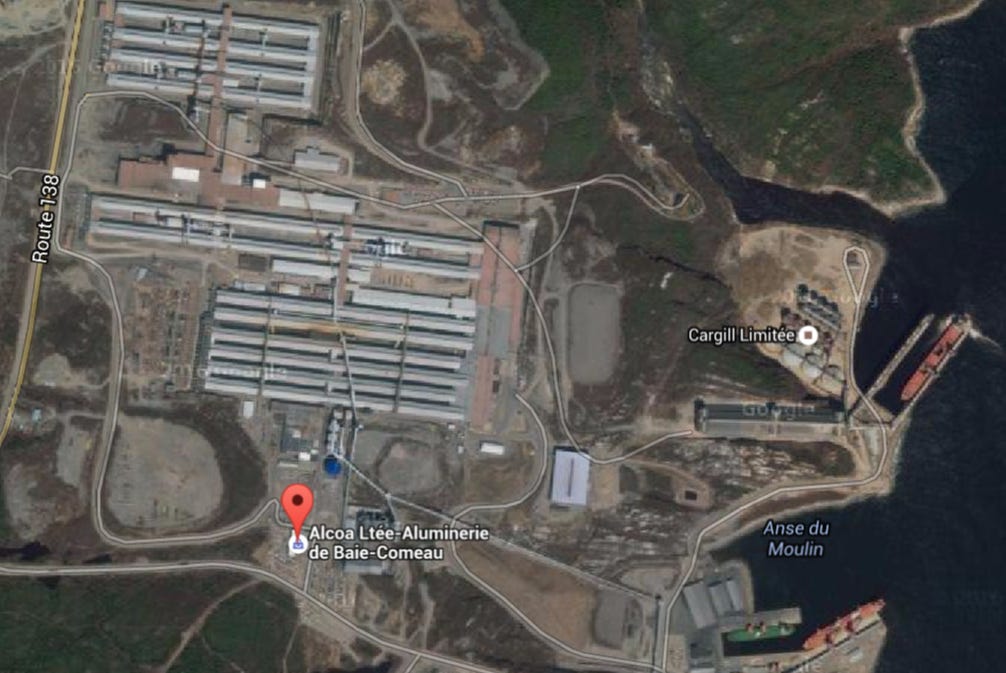
Alcoa has 26 smelters worldwide. These smelters are huge consumers of electricity, which is why Alcoa’s biggest smelter is at Baie Comeau, Quebec, where cheap power comes from water stored at the doughnut-shaped reservoir to its north. (In case you’re wondering about the shape: the lake fills part of the impact crater left by a meteor strike 214 million years ago.)
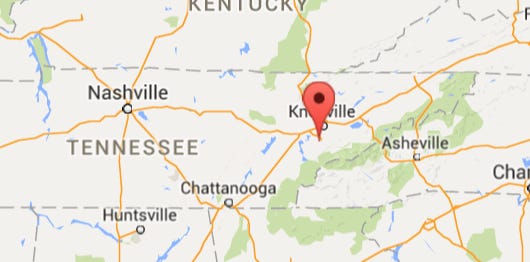
Alcoa has been forced to close smelters when power costs became too high. That's what happened to Alcoa in the Tennessee town called Alcoa, though the company continues to fabricate aluminum sheets there for beverage cans.
Technicality: Alcoa was broken in two in 2016. The part now called Alcoa mines and smelts. The part that fabricates, like this plant, is now called Arconic.
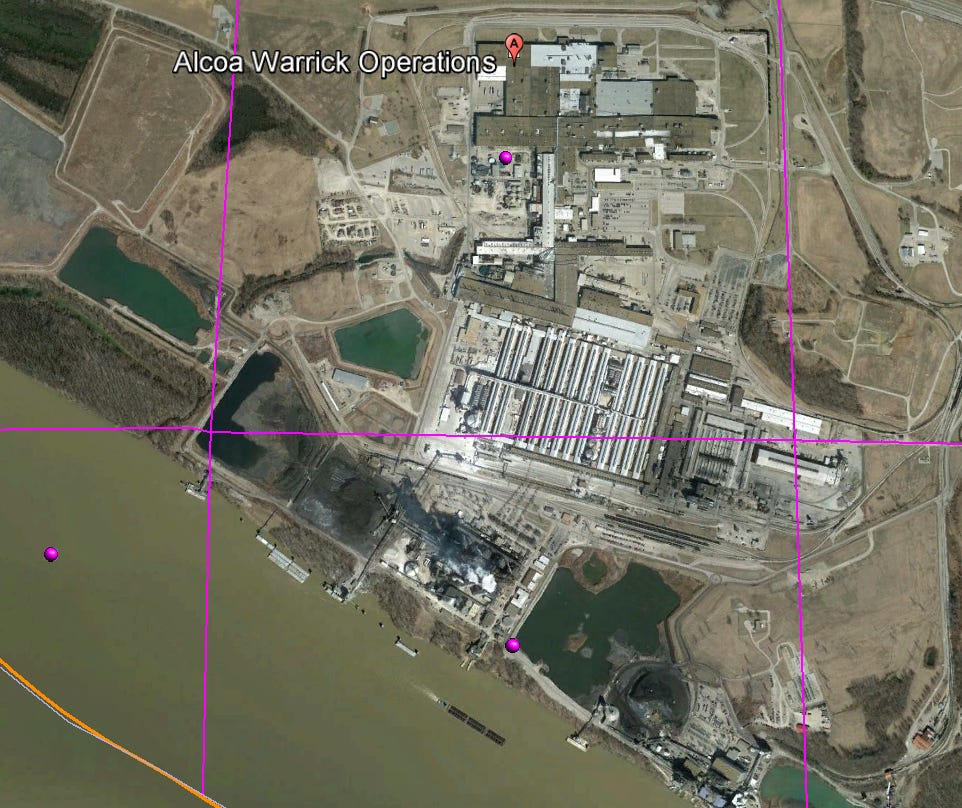
Alcoa also has a smelter and rolling mill near Evansville, Indiana.
In other words, the plant starts with bauxite and ends with aluminum sheets. Update: in 2020 the company announced that it would sell the rolling mill to Kaiser Aluminum.
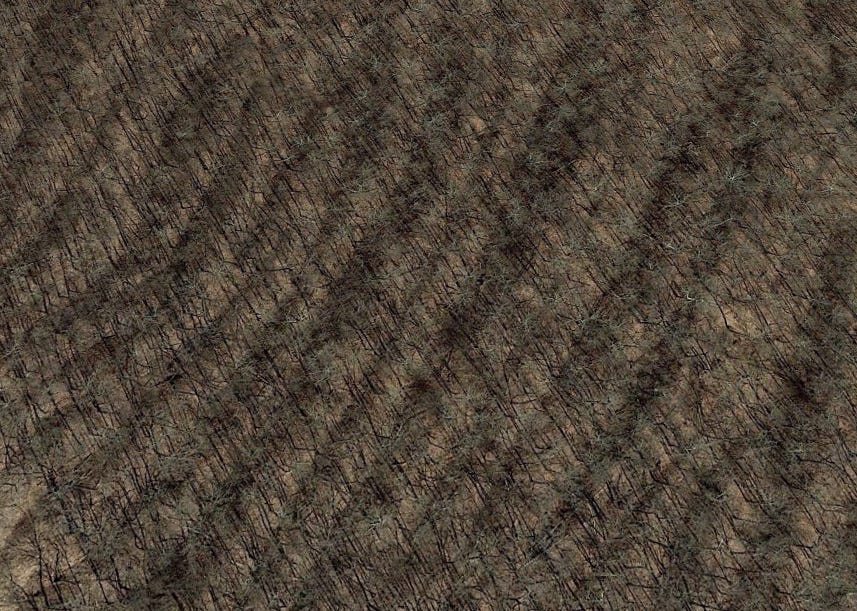
Where’s the cheap power coming from for the smelter? Answer: Alcoa owns nearby coal mines. Scout the countryside, and you can see the old mined surface, which looks like a washboard.
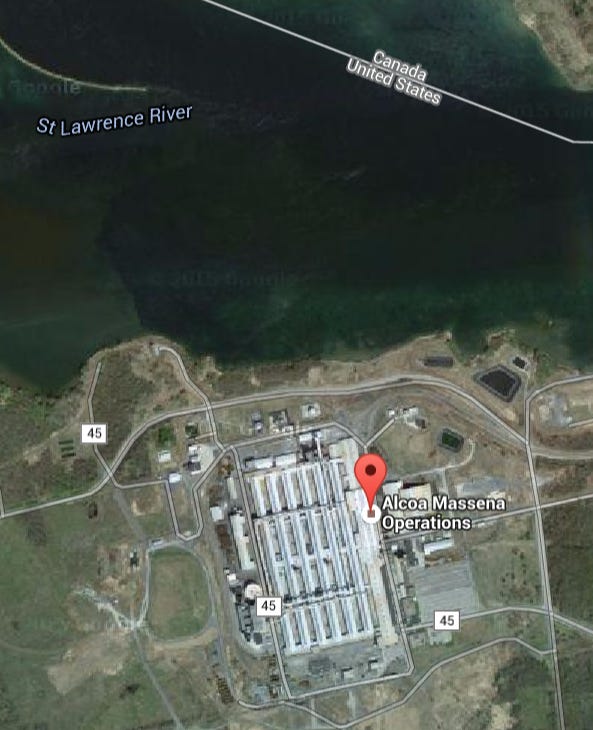
Alcoa also has a smelter on the St. Lawrence River, and it’s been kept alive with subsidies from New York State.
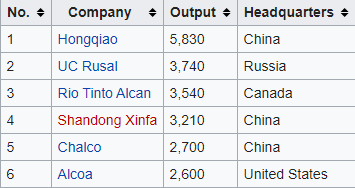
Worldwide, Alcoa ranks No. 6 as an aluminum producer.
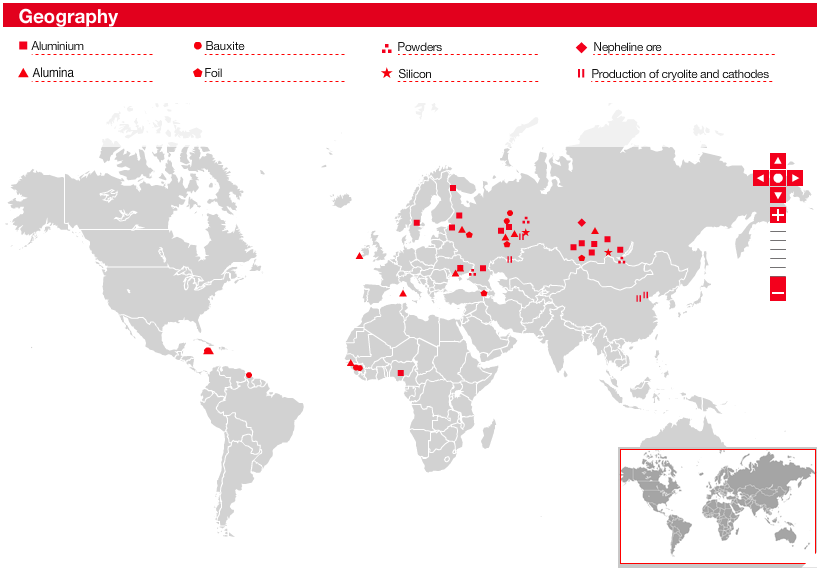
One of its competitors is Rusal (“Russian Aluminum”), which relies primarily on bauxite mined in Guinea and smelted in Siberia, where the company uses cheap hydropower..
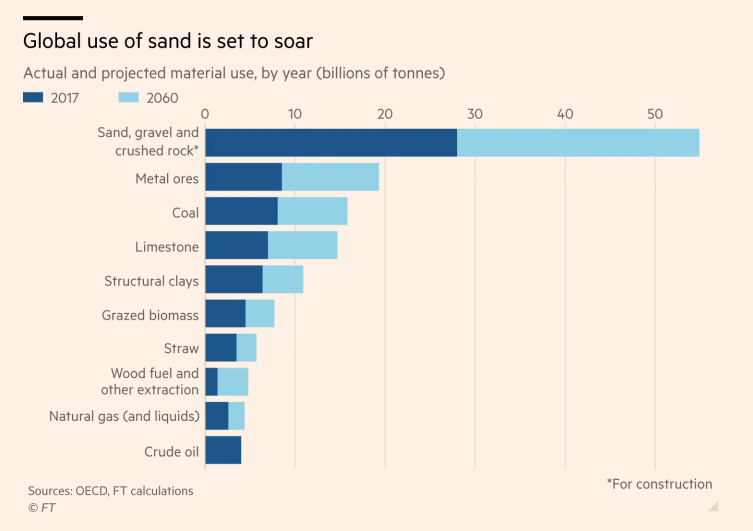
I want to shift now from metallic ores to coal, but this is a good time to point out that, measured by tonnage rather than value, metallic ores and coal are both far behind sand, gravel, and crushed rock.
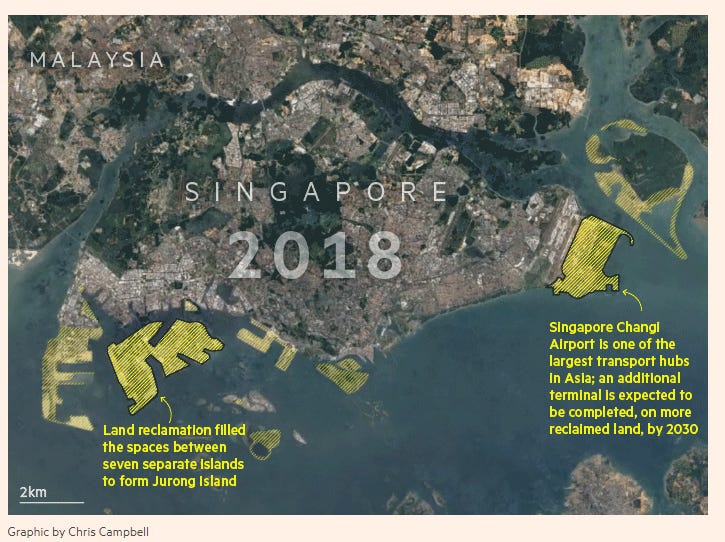
Land reclamation uses lots of it. Here’s a good example: Singapore’s airport and, over on the other side, Jurong Island.
Bahrain and the UAE also import sand. You’d think they already had all the sand they could ever use, but Arabian sand has rounded grains, which make it unsuitable for concrete. For that reason, the concrete in Dubai’s iconic Burj Khalifa appears to have been made with jagged sand from Australia.
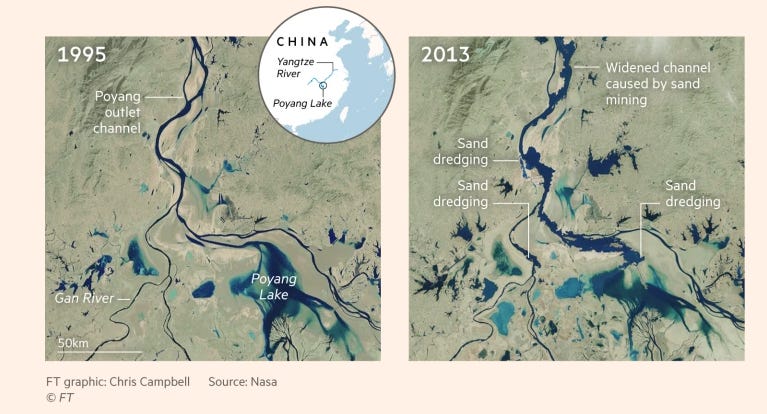
Here’s what may be the biggest sand mine in the world. Since China banned sand mining from the Yangtze, miners have moved upstream to the remaining bits of Lake Poyang. They’ve changed its shape appreciably in the last 20 years.
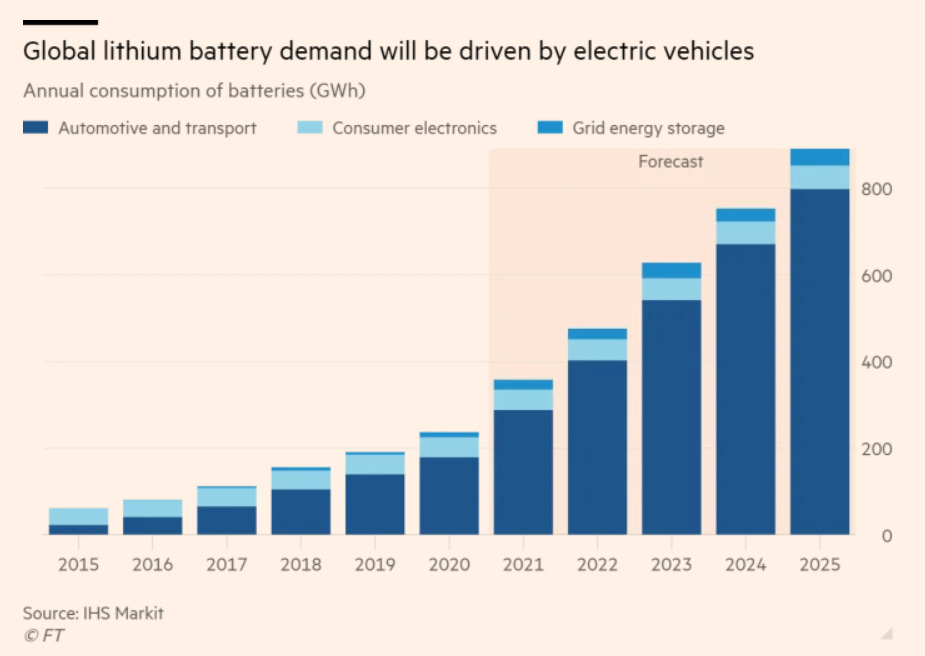
One more detour before we get to coal. It’s for lithium, whose demand is going to skyrocket as the world turns to electric vehicles.
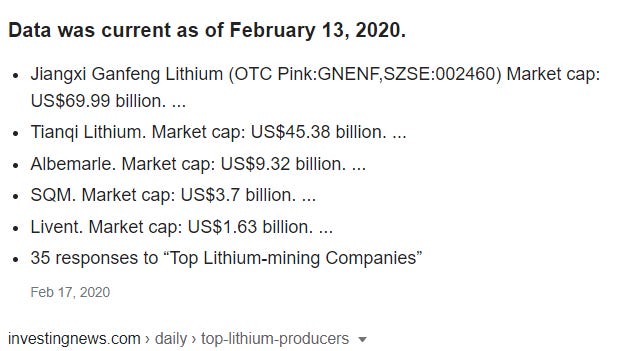
Who’s actually doing the work? It’s a small group, including two Chinese companies far in the lead, followed by two American companies and one Chilean company (SQM).
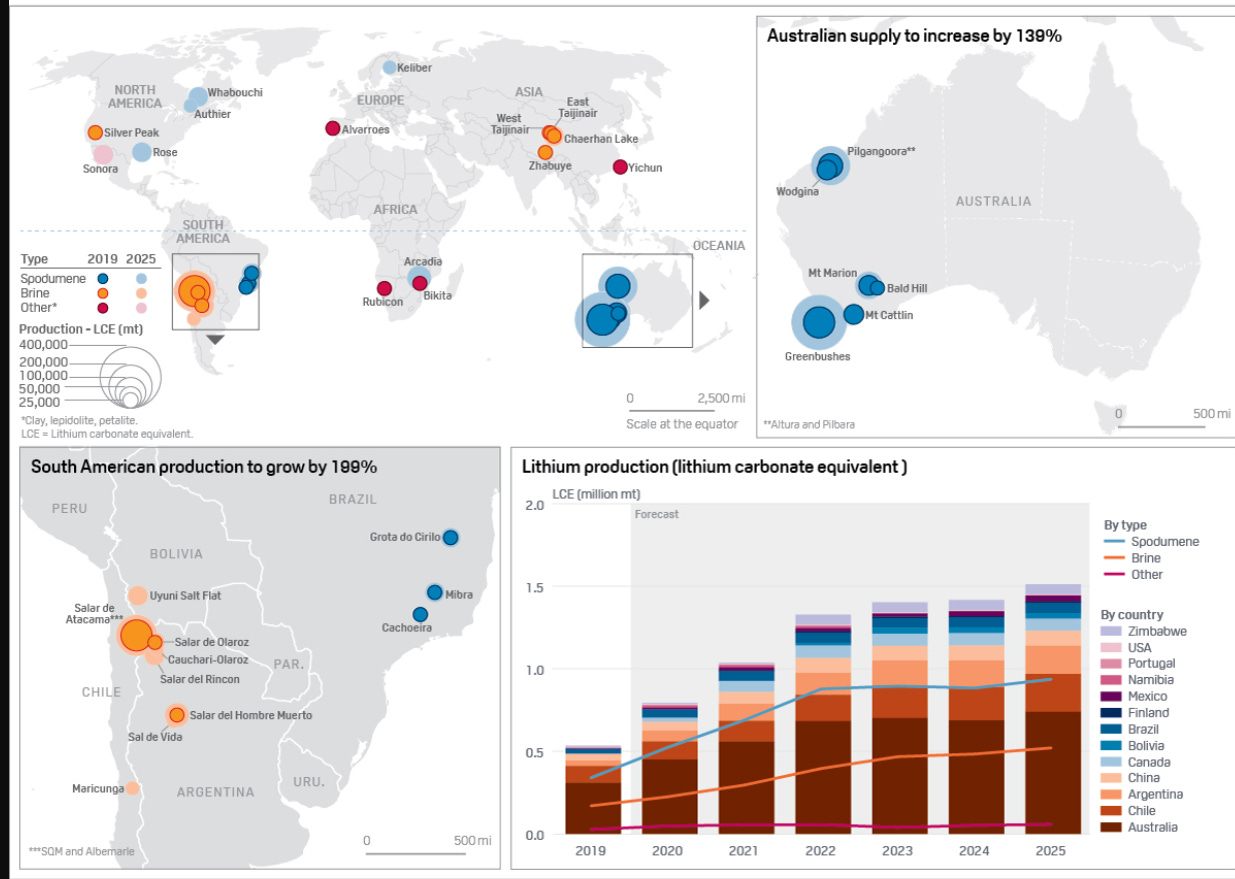
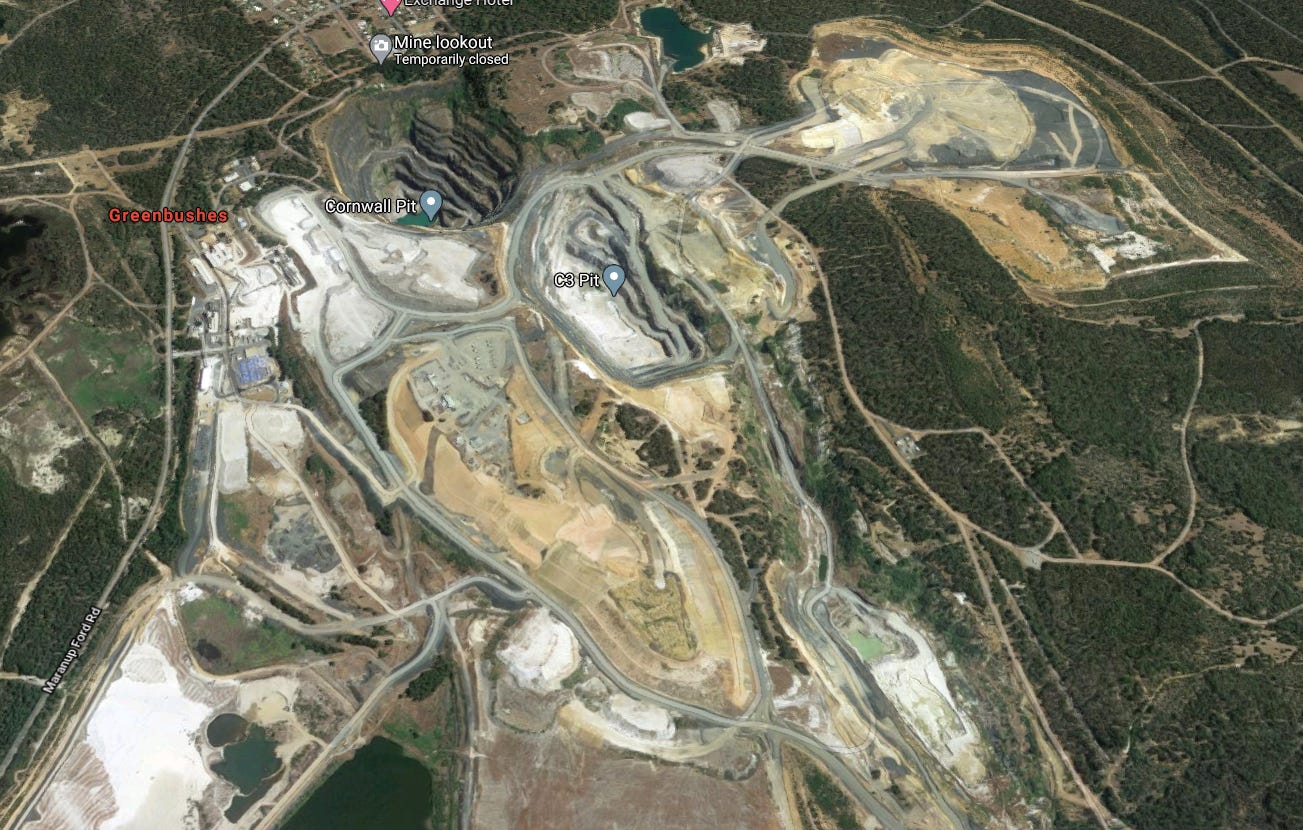
Historically, lithium was produced by hard-rock mining, and the world’s biggest lithium mine still operates that way. It’s the Greenbushes mine, about 100 miles south of Alcoa’s bauxite giant, the Huntly Mine. Greenbushes started out in the late 19th century as a tin mine, and you can see the pit dug at that time: it’s at the upper left and is labelled the Cornwall Pit (near the Mine Lookout). It began mining lithium in 1985. Who’s doing the work? Tianqi and Albemarle, two of the companies on the last page.
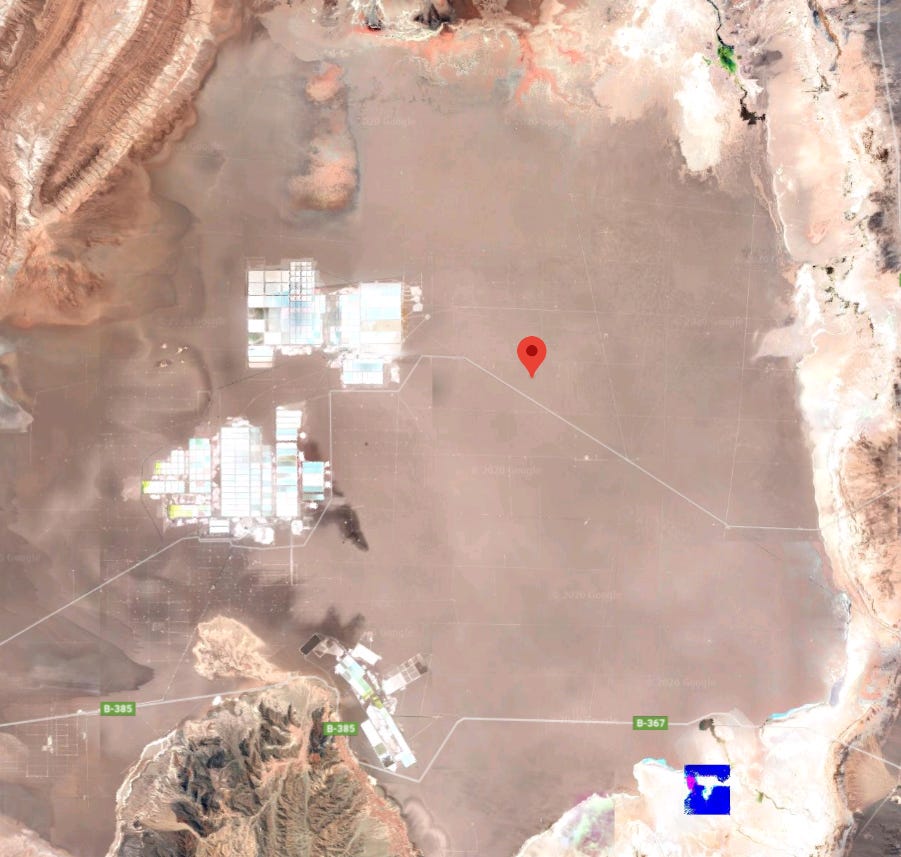
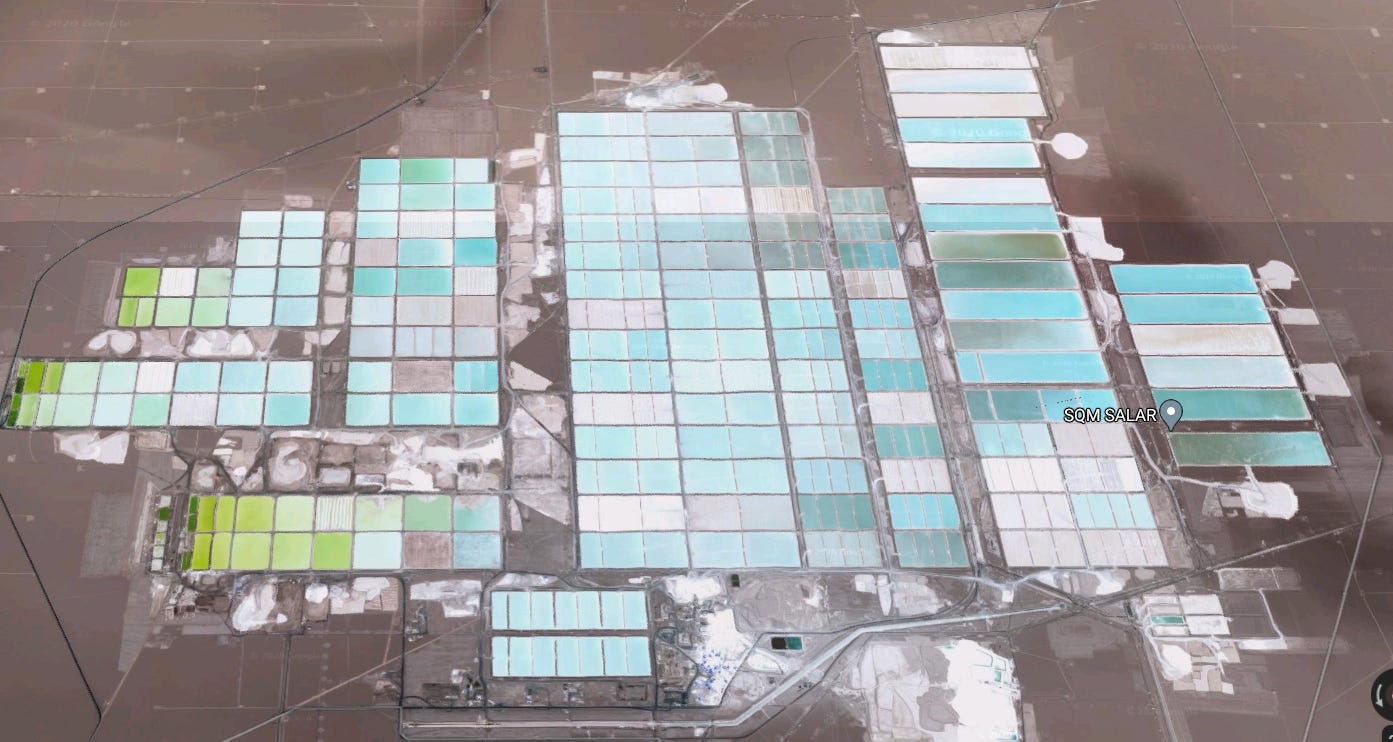
Since the 1980s, lithium has also been mined by processing brine from dry lakes. The biggest source is the Salar de Atacama.
Tianqi owns a quarter of this operation, too, which is run by SQM, the Sociedad Quimica y Minera. Chances are pretty good that the battery in the device you’re using right now depends on lithium from one of these mines.
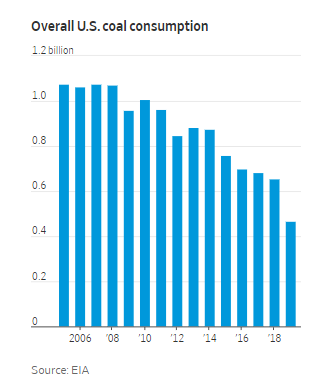
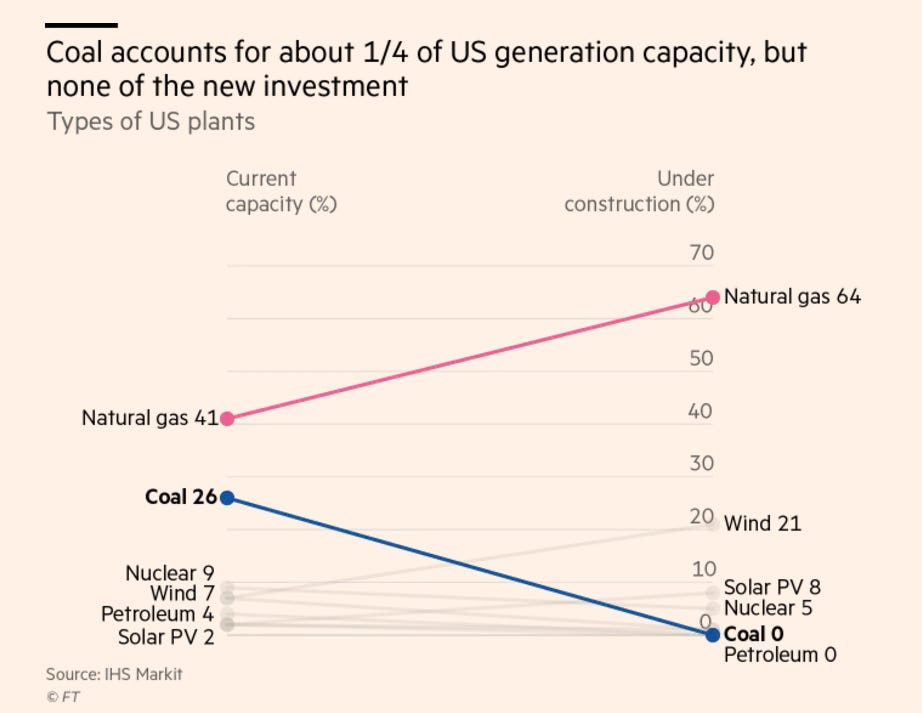
We turn now to coal, an industry in big trouble in the U.S. partly from environmental regulations but more intractably from cheaper energy sources.
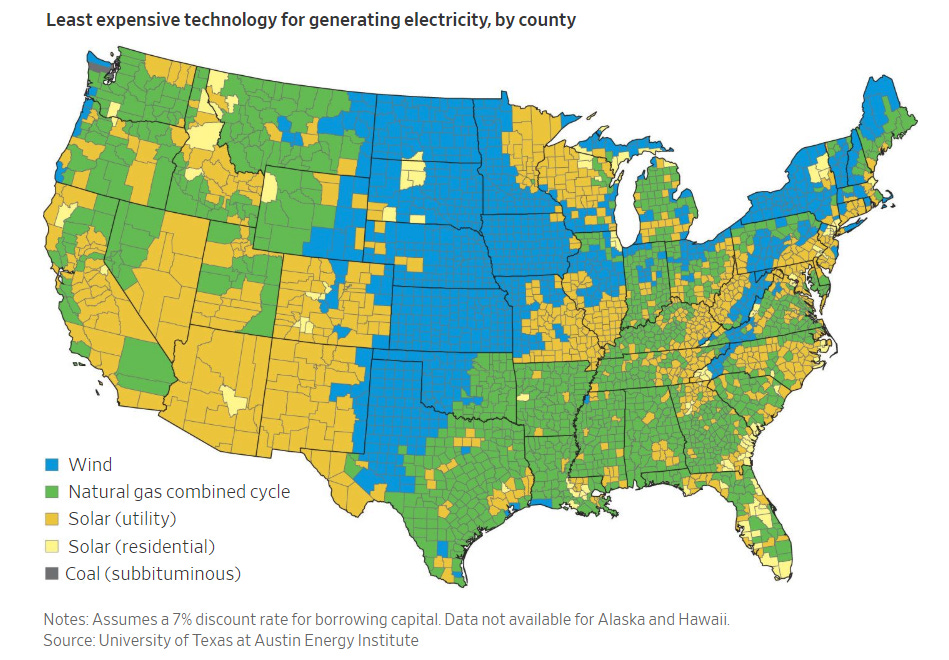
Every county in the U.S. has a cheaper source of electrical energy than coal. We still burn the stuff, but that’s because the coal-plants are built and paid for. If we were starting over, we’d use cheaper alternatives.
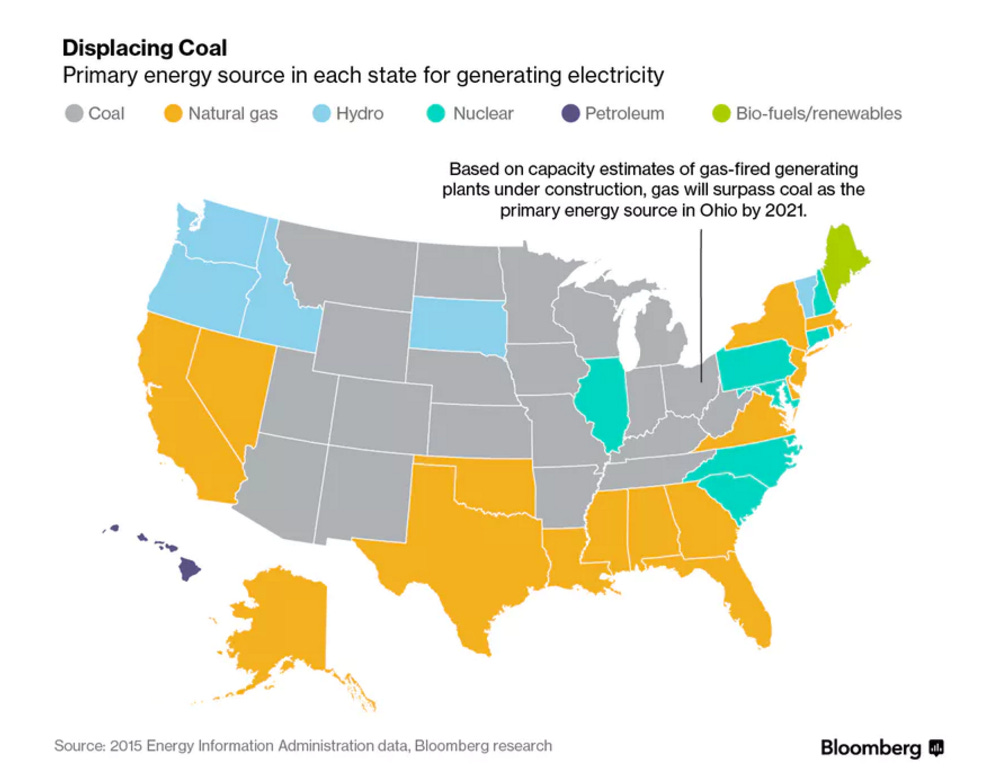
Coal is still the leading fuel in the Rocky Mountain states and the Midwest, but gas is the leader not only in Texas but in the nation’s most populous states: California, New York, and Florida.
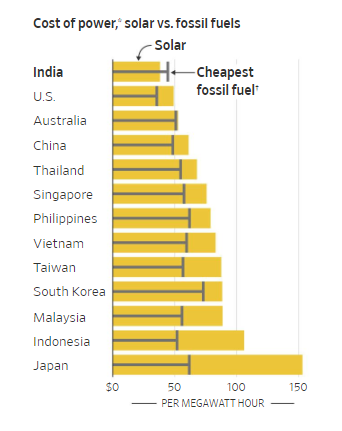
Solar power is especially strong in the sunny Southwest. It’s already cheaper than fossil fuels in India, and it’s catching up in other countries, including the U.S.
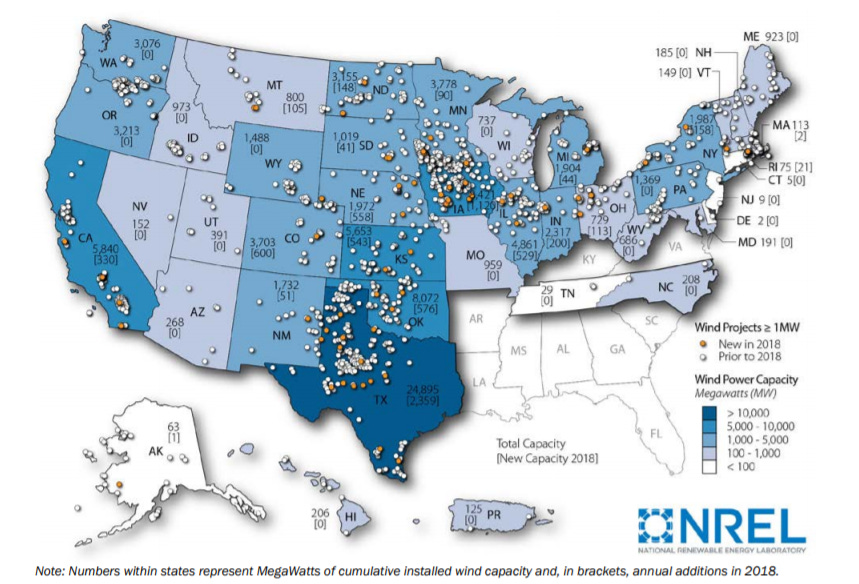
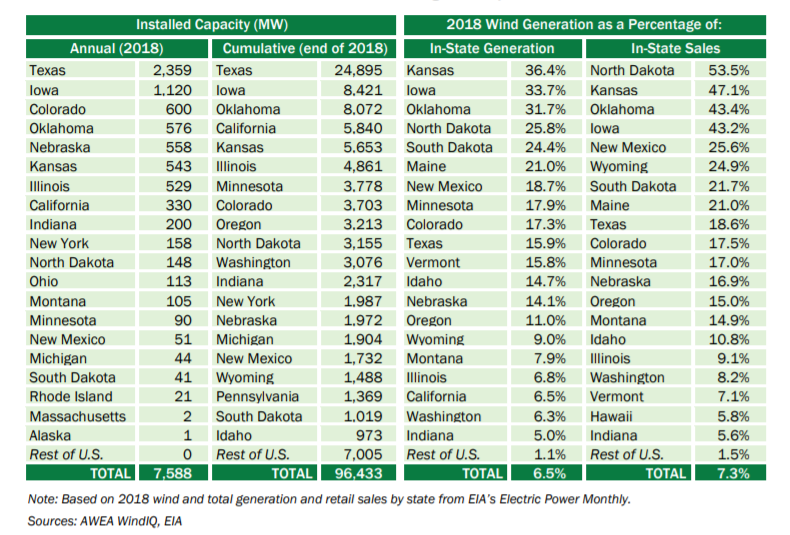
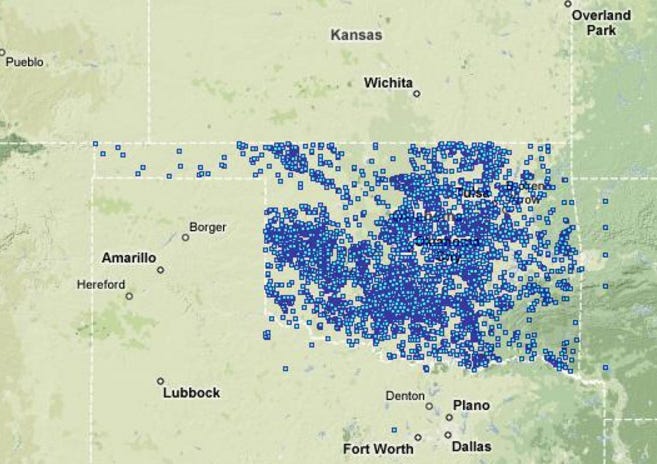
Texas already generates more power from wind than any other state, by far, yet Texas generates only about 16 percent of its electricity from wind. That puts it in 10th place, far behind the leaders, which are Kansas, Iowa, and Oklahoma. That’s what happens when you have a state that uses a lot of power.
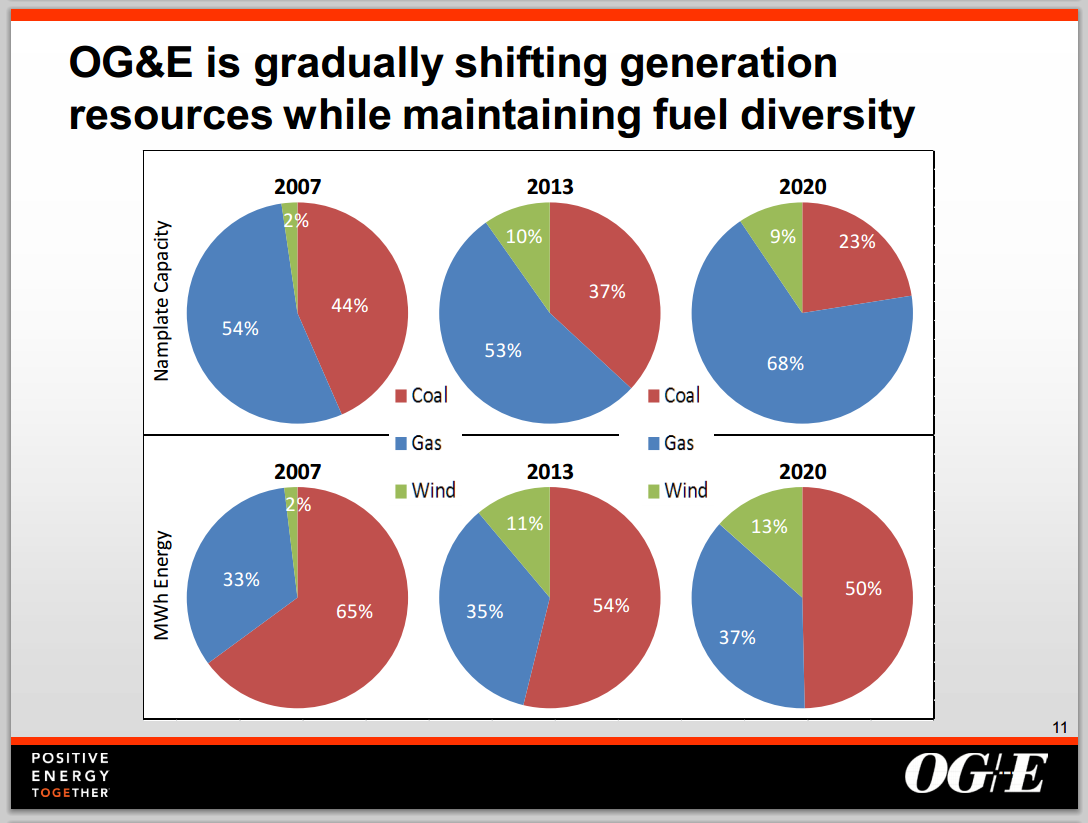
For the time being, the great shift is from coal to natural gas. Oklahoma Gas and Electricity, for example, cut coal from two-thirds of its fuel in 2007 to half in 2020.
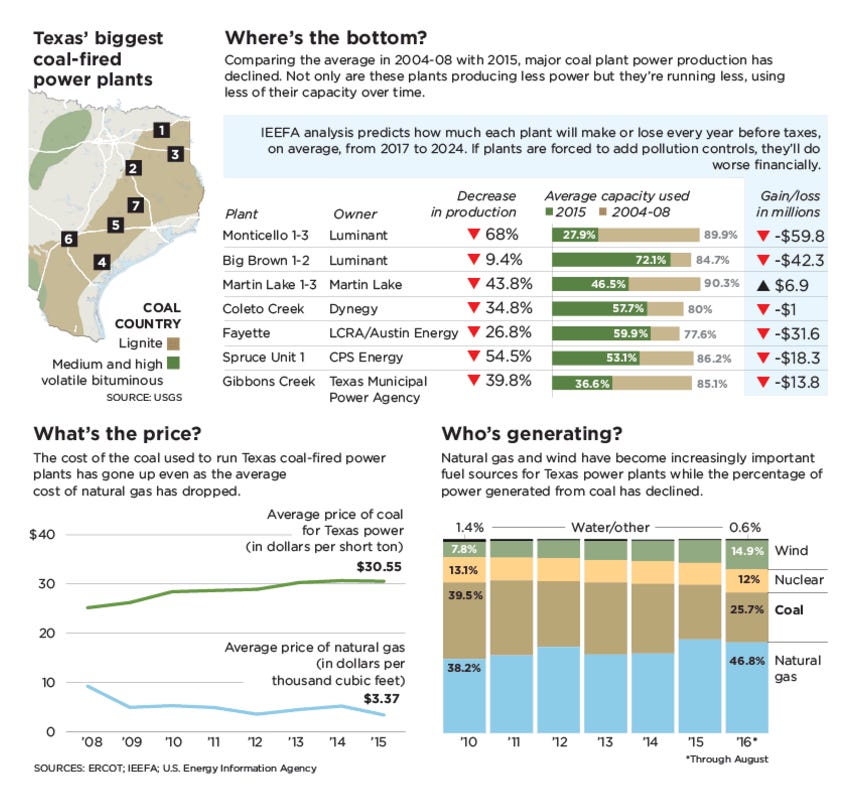
Here’s the picture in Texas, where coal-fired plants produced less power in 2016 than they did in 2008. Over that period, coal declined from producing almost 40% of the power in Texas to producing just over 25%. The contribution of natural gas rose from 38 to 46 percent. (Wind has gained a lot, too; nuclear has been flat.)
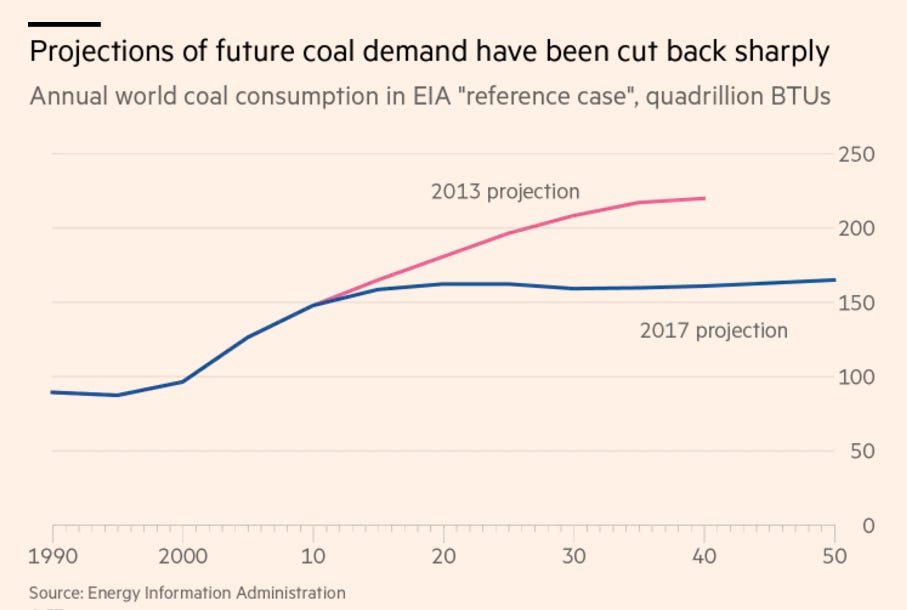
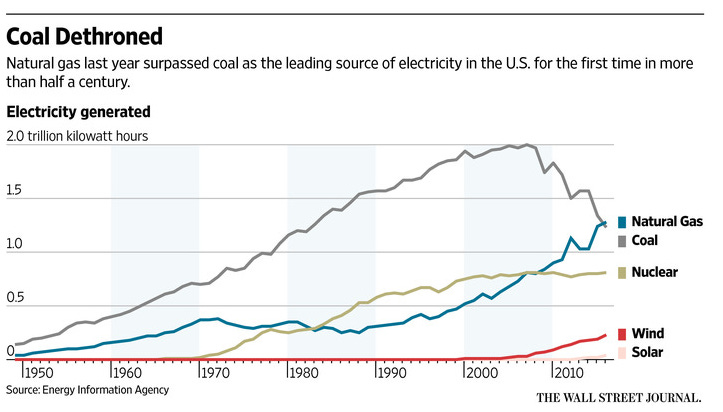
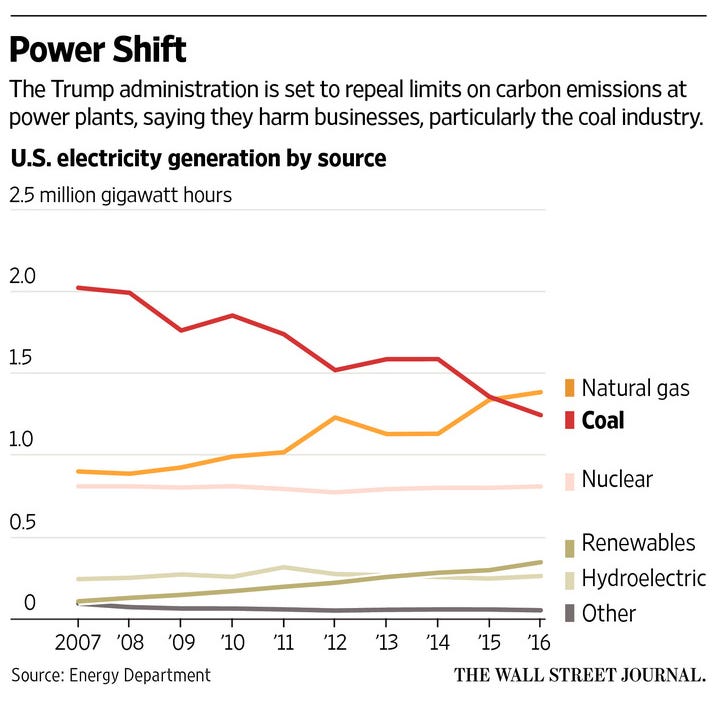
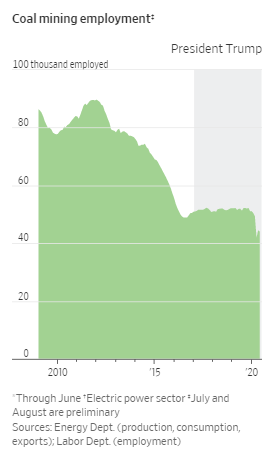
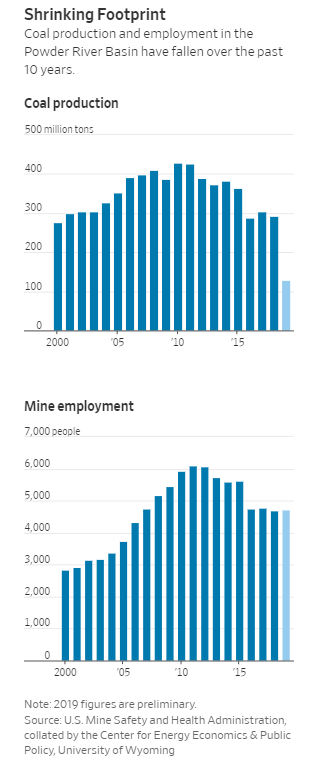
Why the decline in coal? For the answer, look at the lower-left graph. An economist says, “The coal industry doesn’t have a regulation problem. It has a market problem with competitors that can do the same thing at lower cost.”
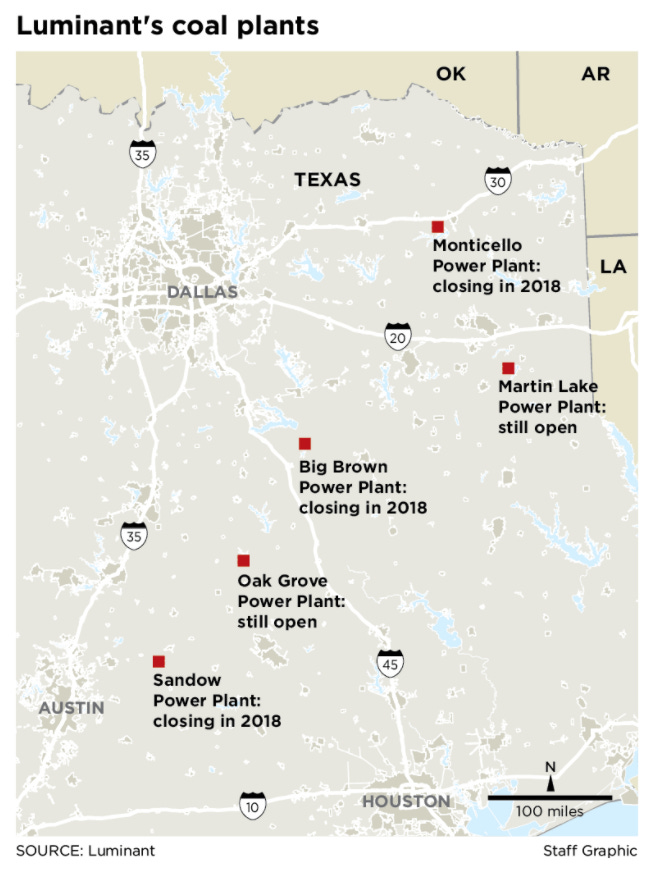
Luminant, the biggest power generator in Texas, announced in 2017 that it would close three coal-fired plants in 2018. The decision wasn’t a tough one: the company said that power from these plants cost between $60 and $143 per megawatt hour. The company’s cost for power from gas-fired generators was $48 to $78; for wind, from $32 to $62—and that was before subsidies.
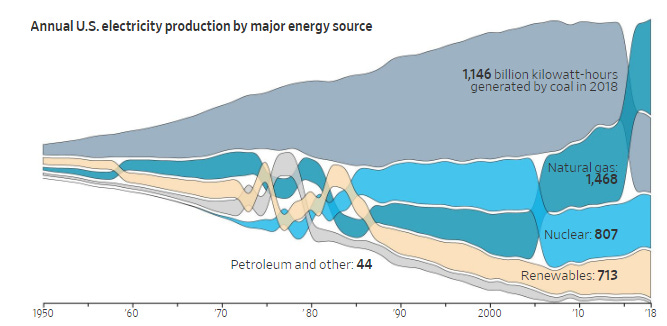
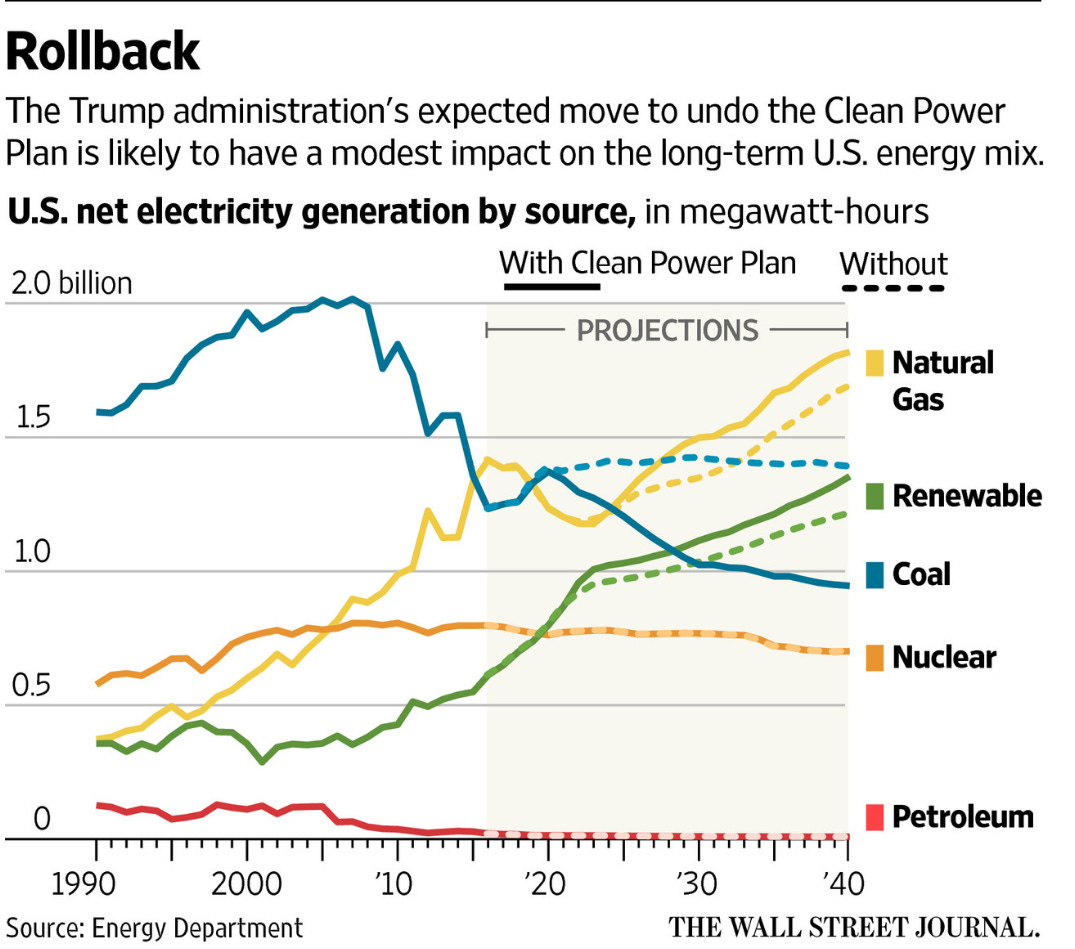
Here’s a national summary over the last 65-plus years, showing coal’s rise and fall. Nuclear is limping along, and wind is trying to grow. So is solar. Gas is thriving.
The federal government itself predicts that scrapping the Obama rules won’t do much to boost coal production. The competition from natural gas is just too strong.
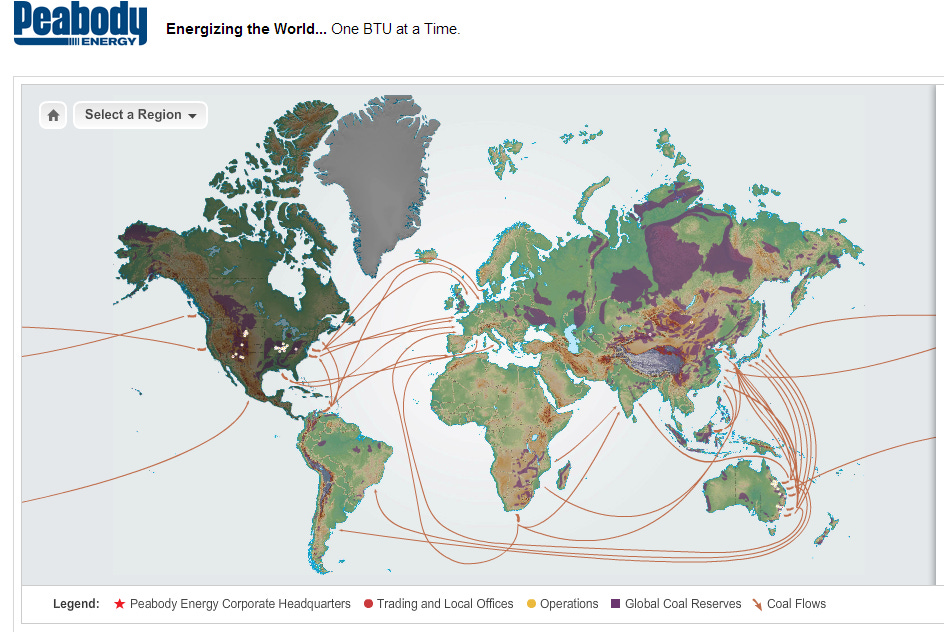
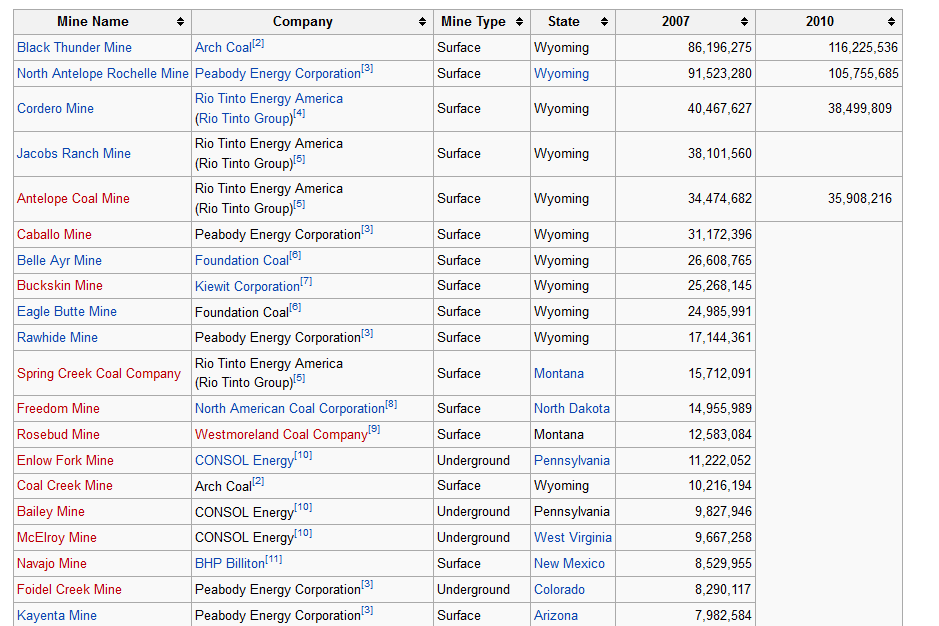
The biggest American coal producer is Peabody, though with annual revenues of only $8 billion it’s way too small to make the Fortune 500 list of the biggest U.S. companies. Notice that Peabody exports coal from Australia to East Asia and South America. It's also exporting from the U.S. chiefly to Europe.
In 2016 Peabody declared bankruptcy under Chapter 11 of the bankruptcy laws. So did Arch Coal and Alpha Resources, big competitors. All had been drowning in debt, and the value of Peabody’s shares had crashed from $20 billion to $38 million (no typo!). Result: the company sold off many of its mines, though the mines themselves continued to operate.
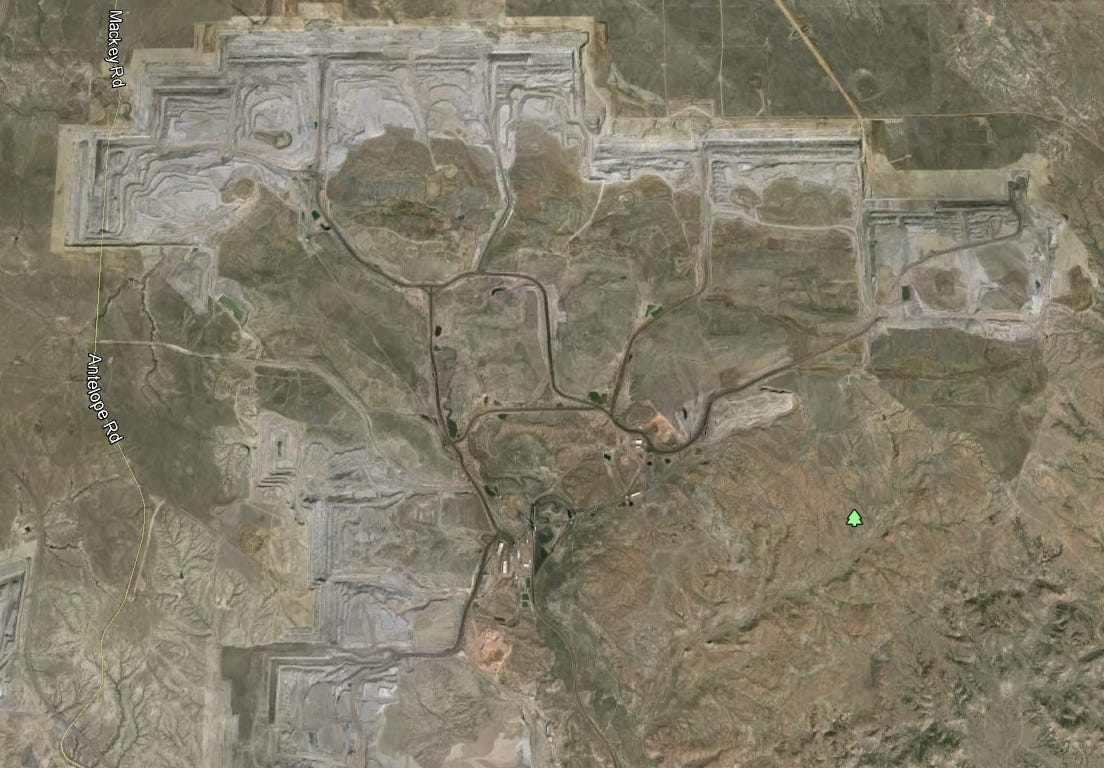
Peabody's flagship mine in the U.S. is this, the North Antelope-Rochelle Mine, a surface mine about 50 miles south of Gillette, Wyoming. Along with 15 other mines in the neighborhood, big surface mines like this have just about killed underground mines, which generally require far more labor to extract a ton of coal. There are lots of YouTube videos of this mine. Here’s one:
Here’s the North Antelope Rochelle with its biggest siblings.
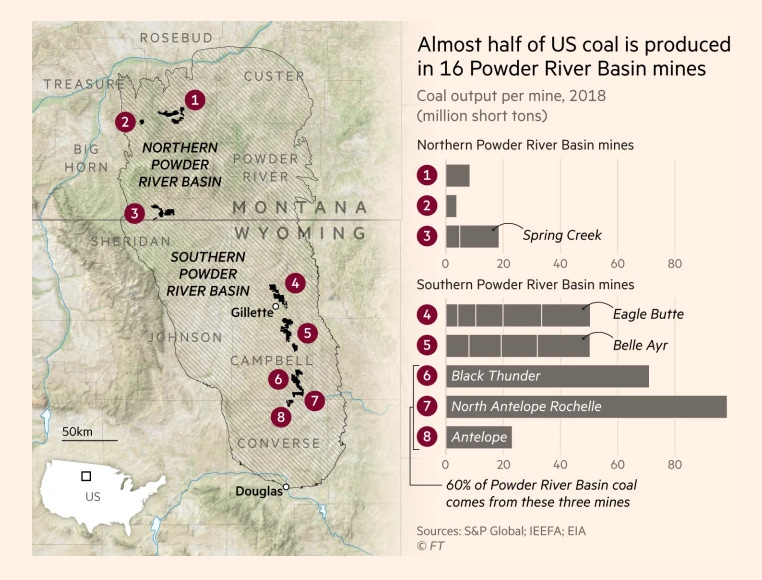
In 2016, Wyoming produced 297 million tons of coal, more than the combined production of the next three states, West Virginia, Pennsylvania, and Kentucky. Nearly all the coal from Wyoming was coming from that lineup we just looked at around Gillette. The eastern mines were underground operations.
Campbell County is huge, though, as the graph to the left of the map shows, it’s hurting, too.
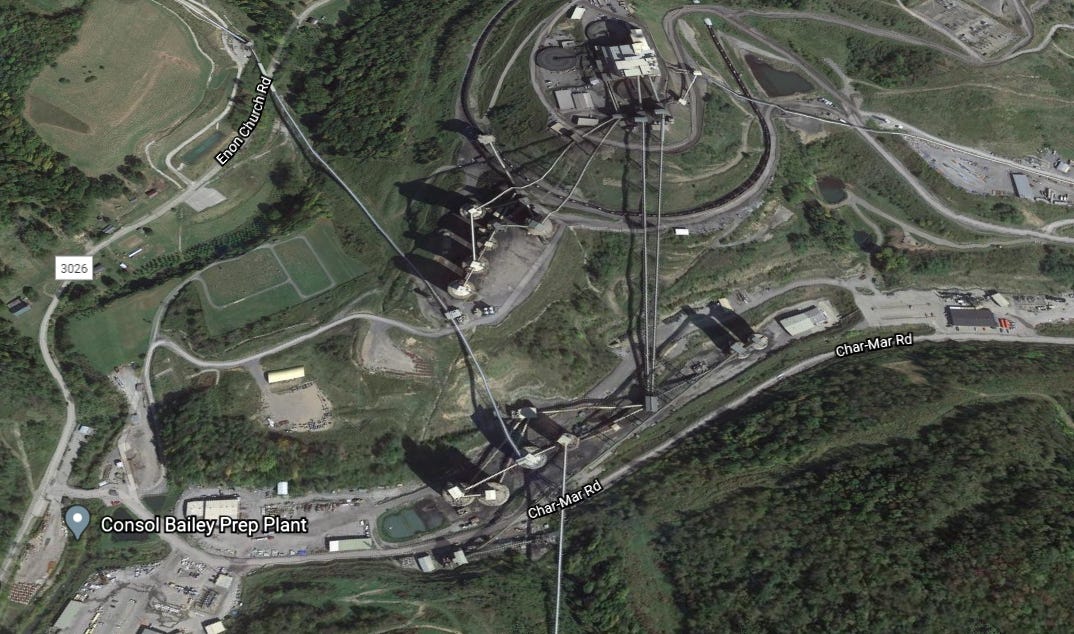
Scan this list of the biggest coal mines in the country, and you have to get down to No.14 to find one east of the Mississippi.
Here’s part of that mine, about two miles northwest of Graysville, Pennsylvania. The mine produces about 8 million tons of coal annually, all from underground, though the surface footprint is not tiny, because a lot of waste rock is brought to the surface and dumped away from this image.
Most of the coal-fired power plants in the U.S. are closer to the underground mines than to the surface ones. Surprisingly, many of the plants burn coal that has travelled a thousand miles or more. Conclusion: surface-mined coal must be cheaper than coal mined underground. It’s a variation of the story with gold, with South Africa’s deep mines are increasingly uncompetitive.
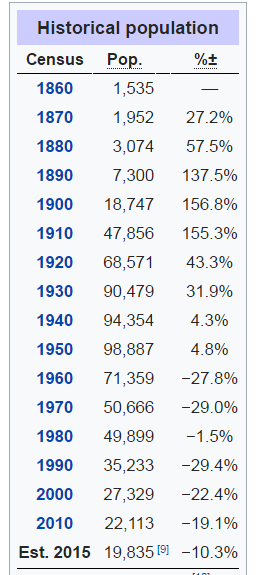
Back in 1950, the #1 coal-producing county in the U.S. was McDowell County in West Virginia. The county had about 15,000 coal miners. Today it has fewer than 1,000.
Coal production in the county has fallen from a 1942 peak of 28 million tons to 2.6 million. The county as a whole has seen its population fall from almost 100,000 in 1950 to under 20,000.
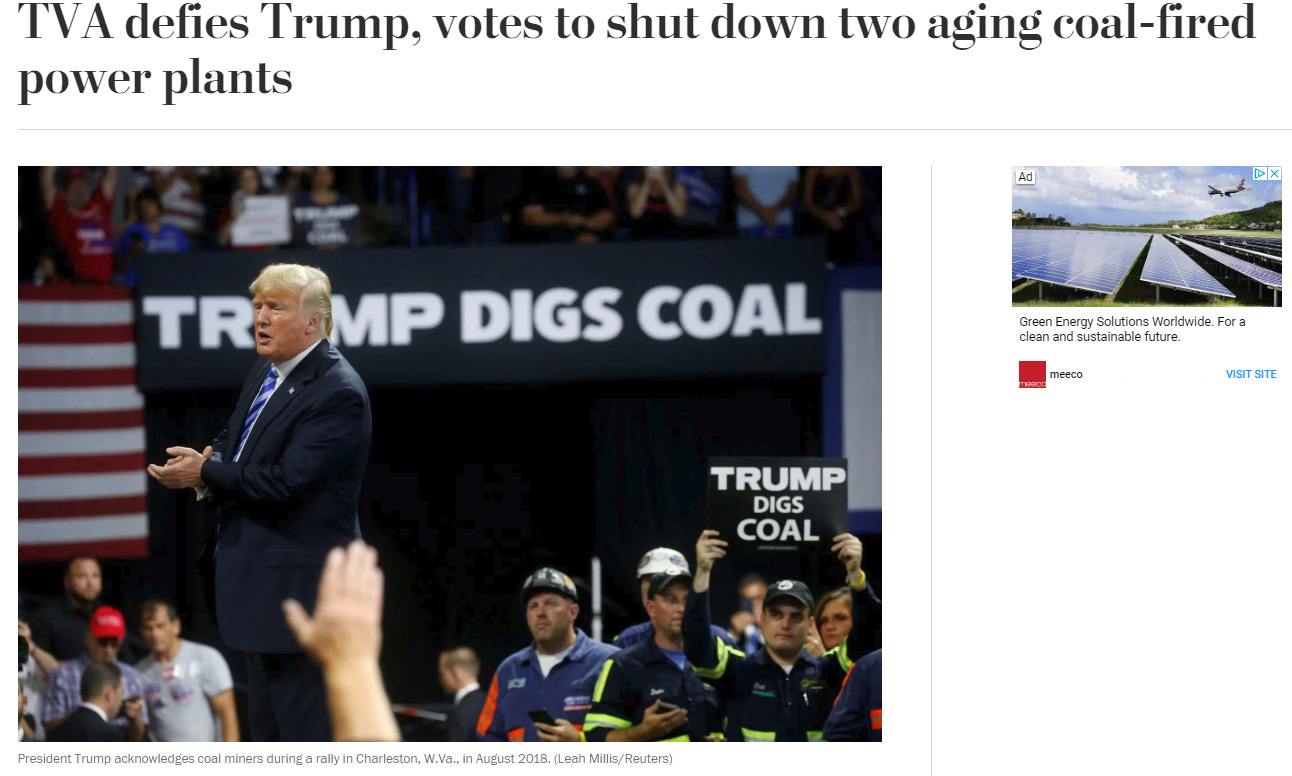
McDowell voted overwhelmingly for Donald Trump in 2016, even though its residents were heavily dependent on the “Obamacare” that Trump promised to repeal. They seemed to think that they wouldn’t need it once he got coal going again. (The county voted for him again in 2020, by a margin of about 80 to 20.)
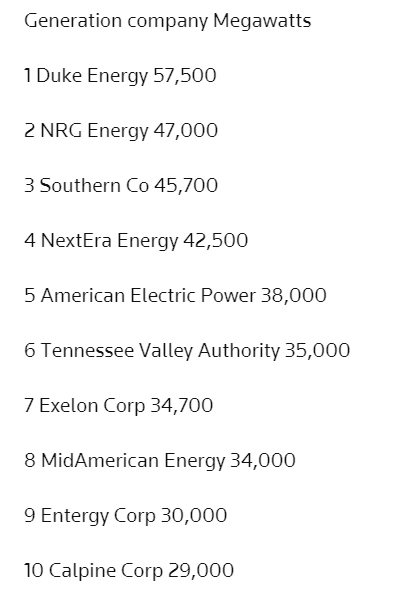
How might Trump have turned things around? The list shows the 10 biggest generators of electricity in the U.S. (data from 2014). They’re all private companies except No. 6, the TVA, a federally owned corporation whose directors are appointed by the president.
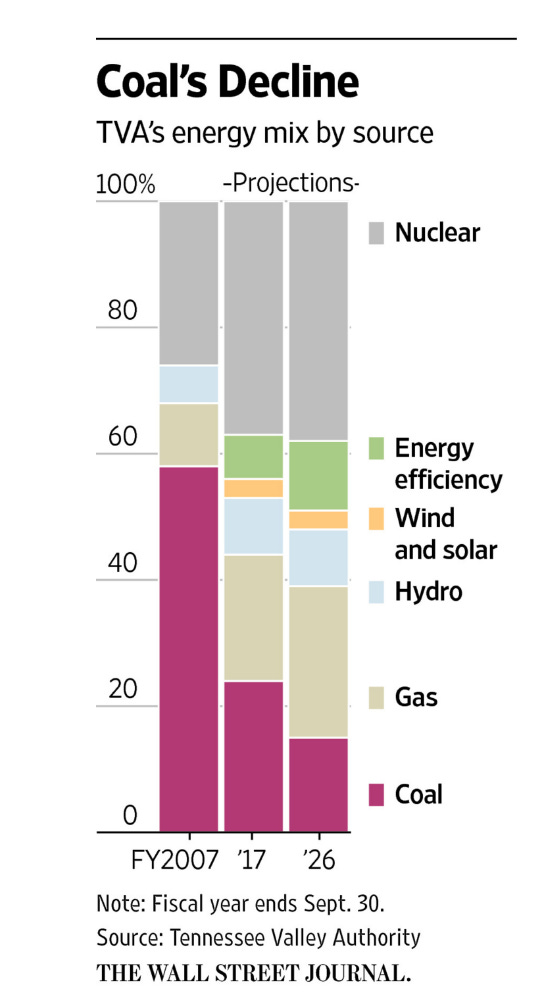
And here’s the fuel mix used by TVA. See the swing to nuclear and gas? The new board might have insisted on buying more coal. It wouldn’t be a national game changer, but it wouldn’t be chickenfeed, either.
On February 14, 2019, the TVA voted to close two coal-fired plants despite presidential tweets. The vote was 6-1 and included three “close the plant” votes from Trump appointees to the TVA board. The chief executive said, “It’s not about coal. This decision is about economics.”
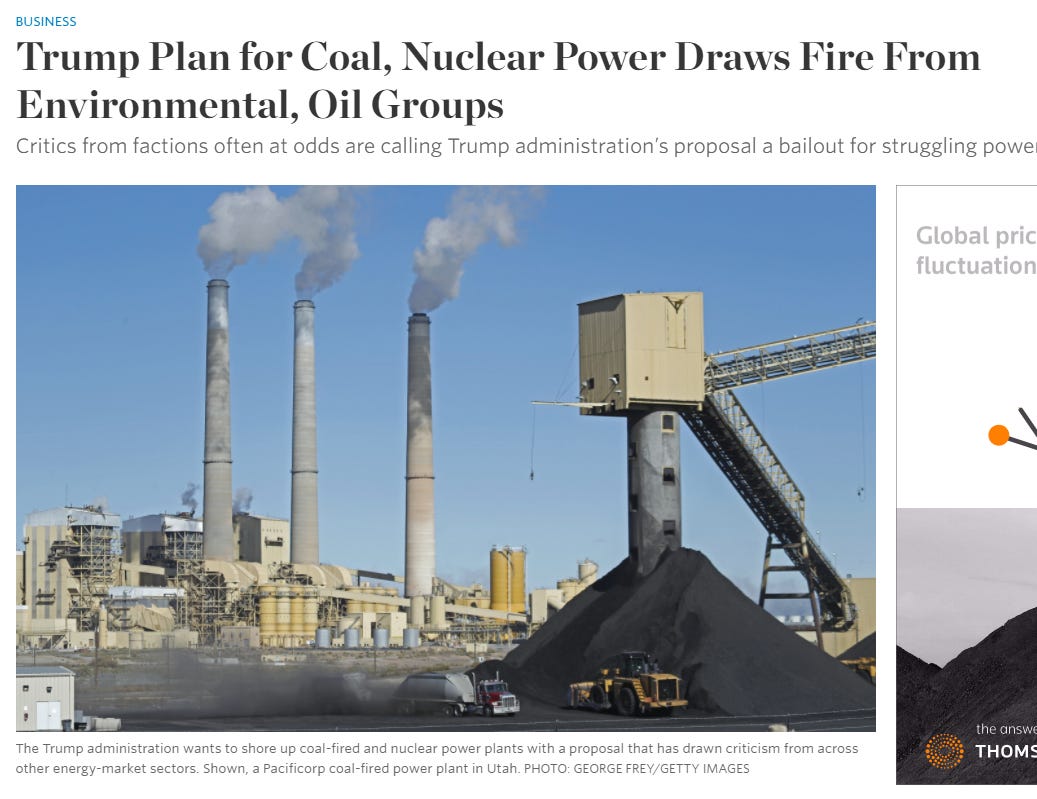
Here was another possibility. The federal government proposed in late 2017 allowing coal-fueled power plants to charge an unspecified premium price for electricity generated from large coal stockpiles if they were maintained on-site. Rationale: big stockpiles provide protection against system failures in the event of a terrorist attack or natural disaster. Therefore, the argument went, they provide national security.
In January, 2018, the Federal Energy Regulatory Commission, whose members were mostly Trump appointees, rejected the plan. One commissioner said, “There’s not enough evidence in the record to suggest there’s a problem. It was more of an attempt to subsidize uncompetitive generation.”
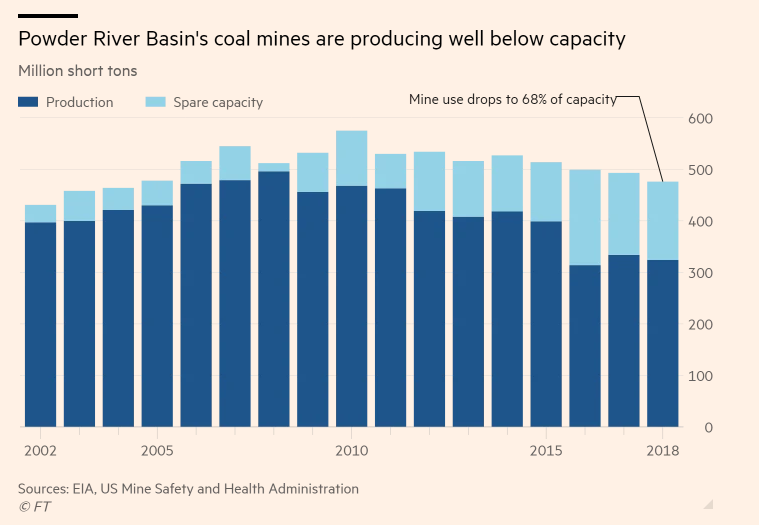
Still, even if you restrict yourself to Wyoming’s Powder River Basin, things look bad. The North Antelope New Rochelle mine was holding pretty steady at about 100 million tons in 2018, but Campbell County’s unemployment rate in March 2018 was 4.2 percent. In July 2019 it was up to 5.7. The national average that month was 3.7.
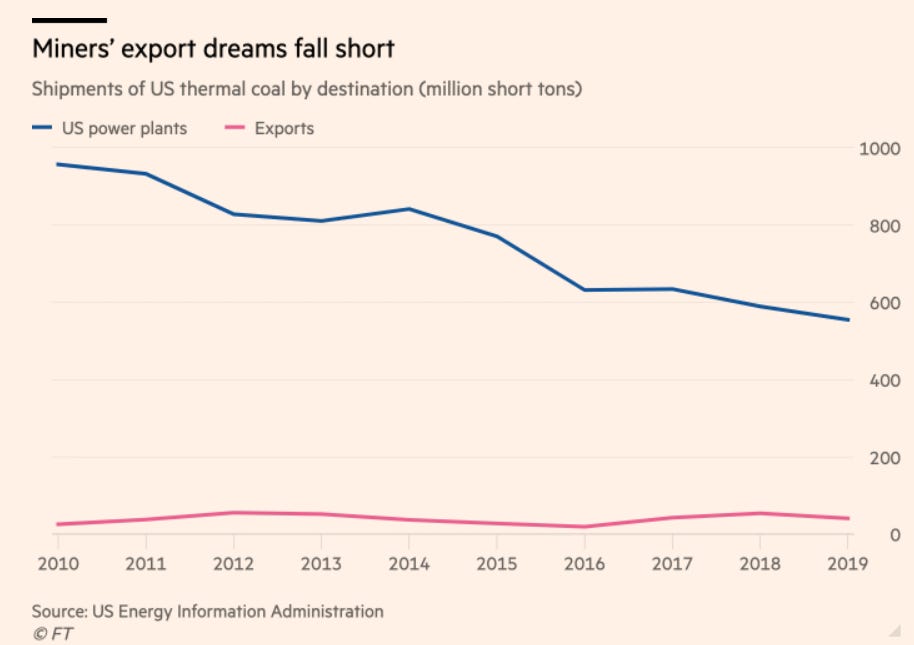
As shipments of coal to U.S. power plants decline, hopes rise that an export market might develop. Plans were developed for the Millennium Bulk Terminal on the lower Columbia River to export 44 million tons annually, but in 2020 they were cancelled in the face of environmental objections.
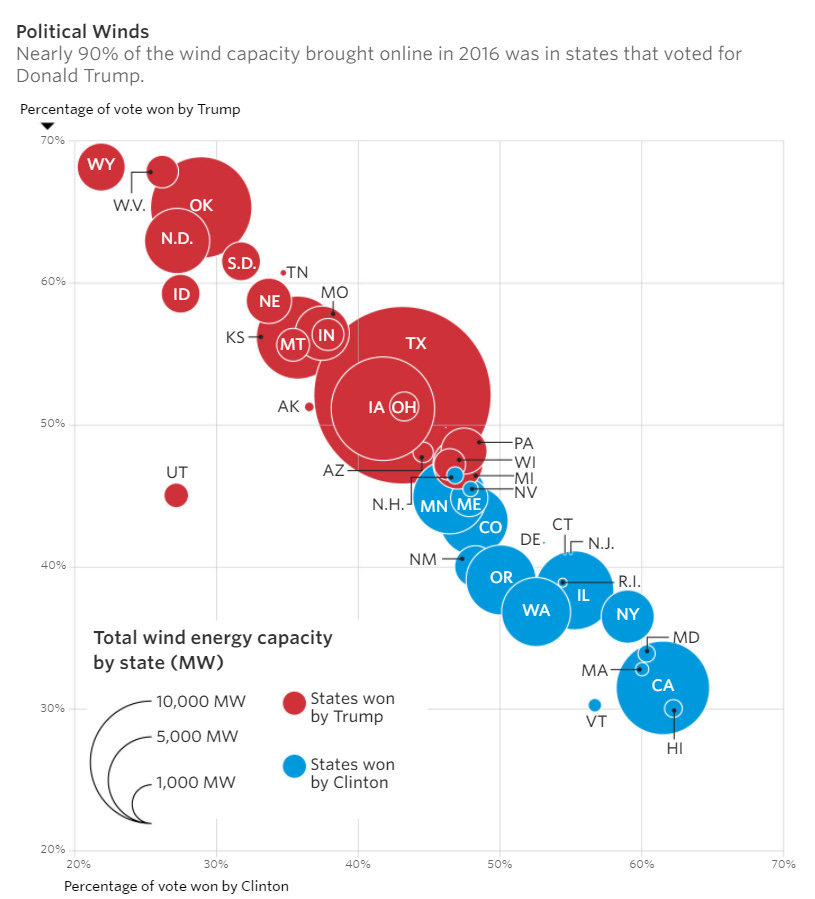
And don’t expect President Trump’s electoral base to oppose the development of renewable power just because wind and solar compete with coal. Most solar development is being installed in states that supported Trump, and lots of voters in those places are happy with an industry that creates jobs, pays taxes, and makes money for landowners.
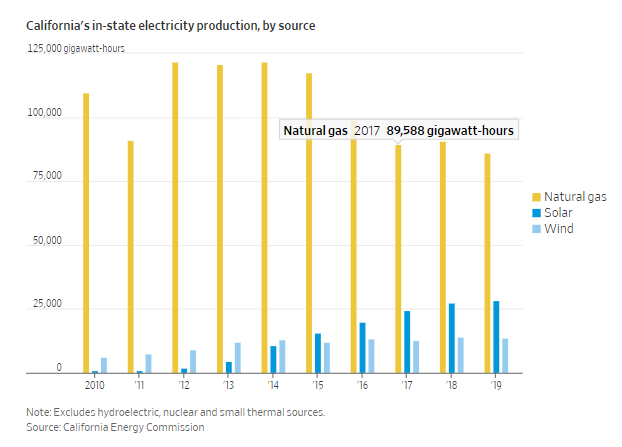
But hang on. Two points. First, be careful what you wish for. California has pushed hard for solar and wind. It figured that if peak demand in the late afternoon couldn’t be met by solar and wind, then the state could buy power from elsewhere. In 2020, “elsewhere” was short on power and had none to sell: think of it as like going to the airport on Thanksgiving and expecting to fly standby. The result: “greenouts,” where in the pursuit of virtue Californians in the summer of 2020 were facing rolling blackouts.
The other point is that coal production worldwide is stable. Replacing it would require an almost inconceivable number of solar panels, wind turbines, and gas wells.
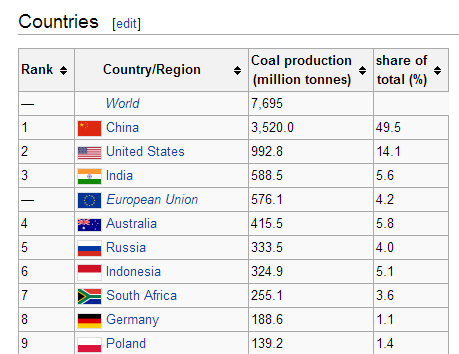
Who’s the biggest producer of coal? Silly question. American coal is now almost a footnote compared to China, which produces as much as the rest of the top ten producing countries combined.
Another nostalgia moment: in 1913, the U.S. produced 39 percent of the world’s coal and consumed 37 percent of it. The nearest rival was Germany, producing 21 percent and consuming 19 percent.
From the World Atlas of Commercial Geology, published by the USGS in 1921.
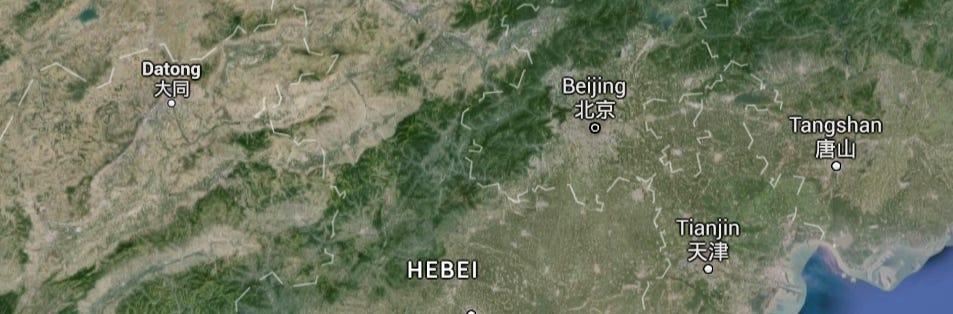
China’s coal today comes largely from Shanxi Province, sometimes called China’s Wyoming. (It’s the province west of the North China Plain.) Notice the profusion of proposed coal-fired power stations.
Some Chinese mines are still very primitive. Here’s an example from Yunnan. The kid with the pannier on his back just climbed out of a shaft.
Here’s what the camera flash showed in that shaft. I was too chicken to go more than a few feet into the hole.
The coal was then carted a mile downhill to a village.
There, it was burned in open braziers like the one in the foreground. The elevation here is over 5,000 feet, so you need some heat.
Head west of Datong, Shanxi, however, and you’ll find industrial-scale mines, both surface and (like this one, just north of Yukuipucun) underground. Most of the coal is burned locally, then sent over power lines to China’s big cities. Better to burn it here, where pollution is less noticeable. Qualification: better from the viewpoint of Beijing residents; no better at all from the viewpoint of global C02 emissions.
Housing is provided in a new quarter of Datong for 300,000 miners. Somebody has counted and found that there are 1,700 highrise blocks here.
For a short video of the mines and housing, see this:
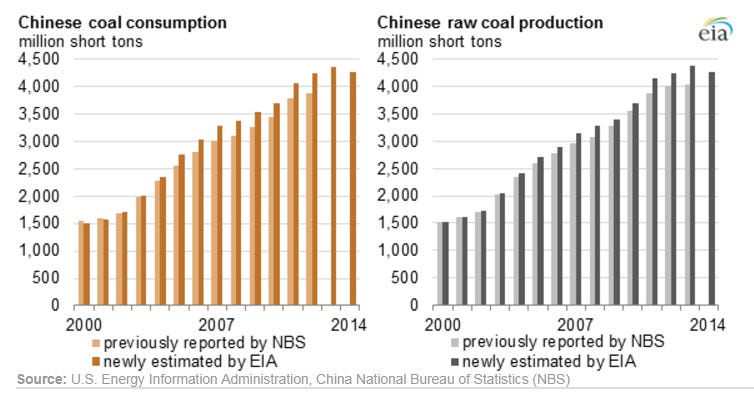
For anyone worried about climate change, this is a very encouraging graph. You see why? Yes, it shows the meteoric rise of Chinese coal production and consumption, but it also shows a decline in the last few years. The graph stops several years ago, but the downward trend has continued, so that production in 2020 is targeted at 3.9 billion tons. Is China using less energy? Of course not: it’s shifting to renewables fast, partly to reduce global warming but also (and probably more) because people in Beijing (and elsewhere) would like to be able to step outside and breathe.
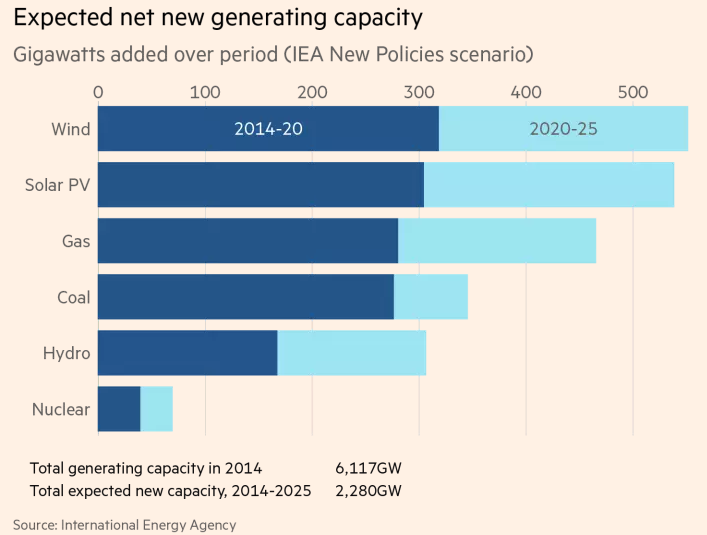
Look at the power coming online around the world during the period 2014-2025. There’s a lot more generated from wind than from coal, and a lot more solar power, too.
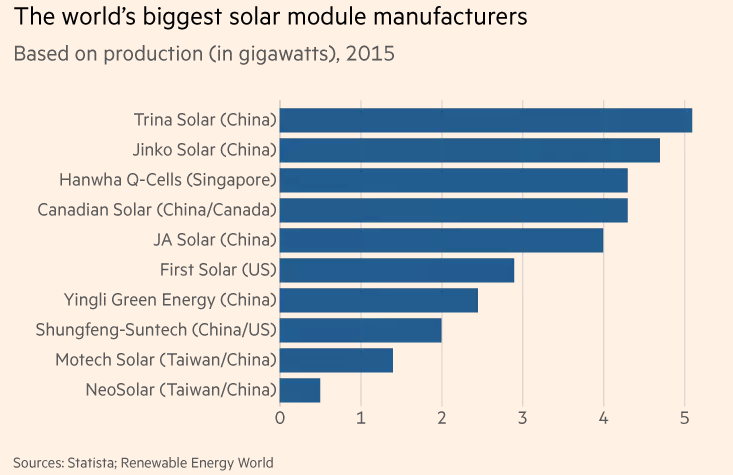
Then look who’s making the equipment for the solar power. China simply dominates the market. America is on the sidelines.
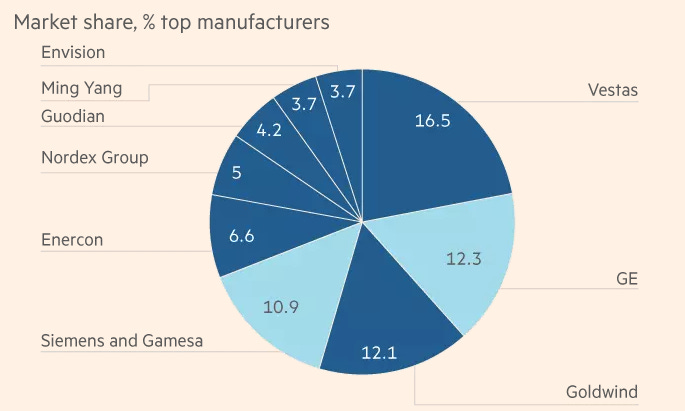
The U.S. is pretty much out of the wind-power business, too. GE is a significant player, but all the other big companies are foreign. Vestas is Danish, Goldwind is Chinese, Siemens, Enercon, and Nordex are German, and the other three shown here are all Chinese.
Despite this encouraging trend, China is still not only the leading coal producer but one of the world’s top coal importers, along with Japan, South Korea, and India. The imported coal comes mostly from Indonesia and Australia, both of which export three-quarters or more of the coal they produce. For Australia, most of the coal comes from mines near the east coast.
How can it be that China is so involved with solar power yet still imports a lot of coal? Obvious answer: its demand for power is huge.
The table on the left shows that in one recent year China added at least three times more wind-power capacity than any other country; the table on the right shows that its total wind-power capacity is more than twice as much as any other country’s. Looks good, right?
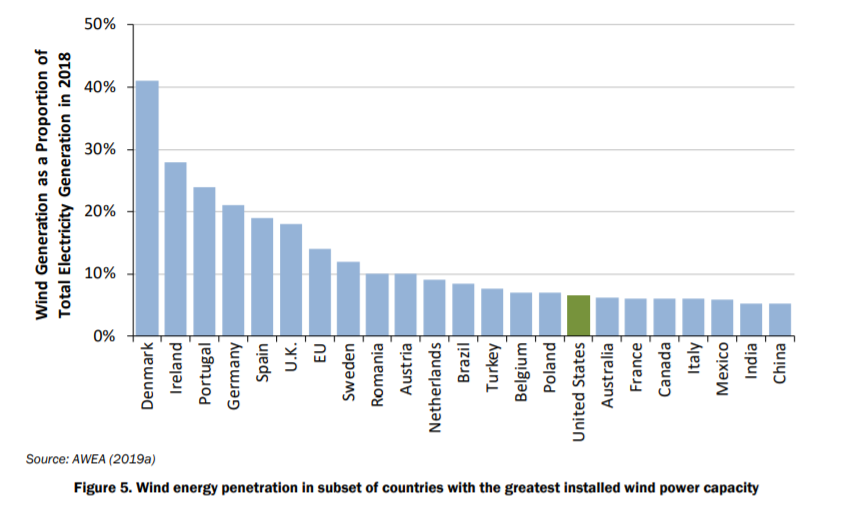
Think again. If you look at the share of China’s electricity that comes from wind power, the country seems like an “also ran.” It’s the Texas story all over again. You can have lots of renewables, but if your consumption is huge, renewables may still generate a lot percentage of your electricity.
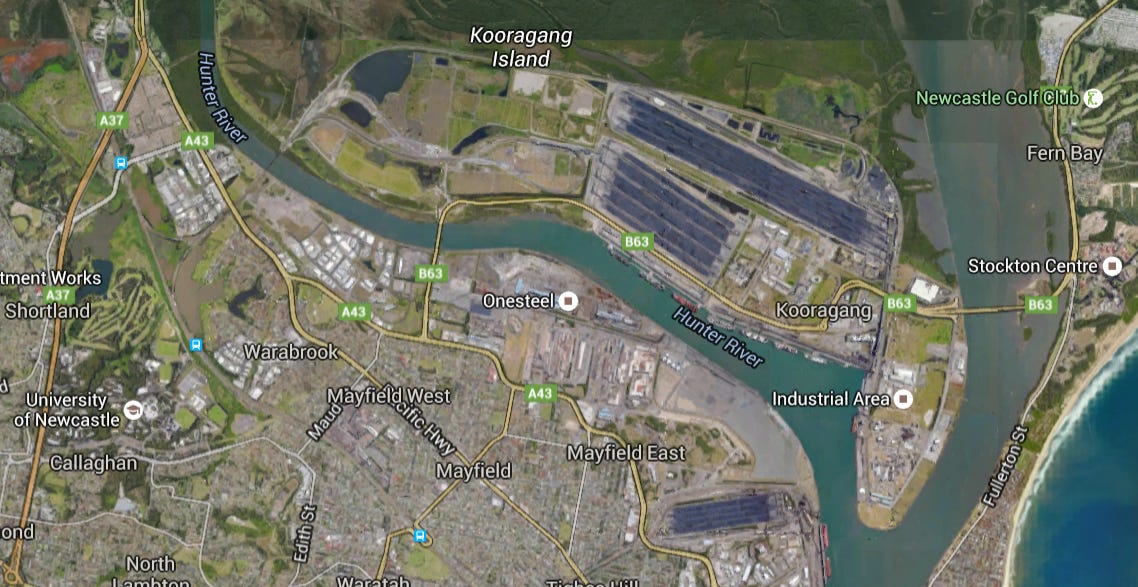
So here are some coal-export terminals at Newcastle, about 100 miles north of Sydney.
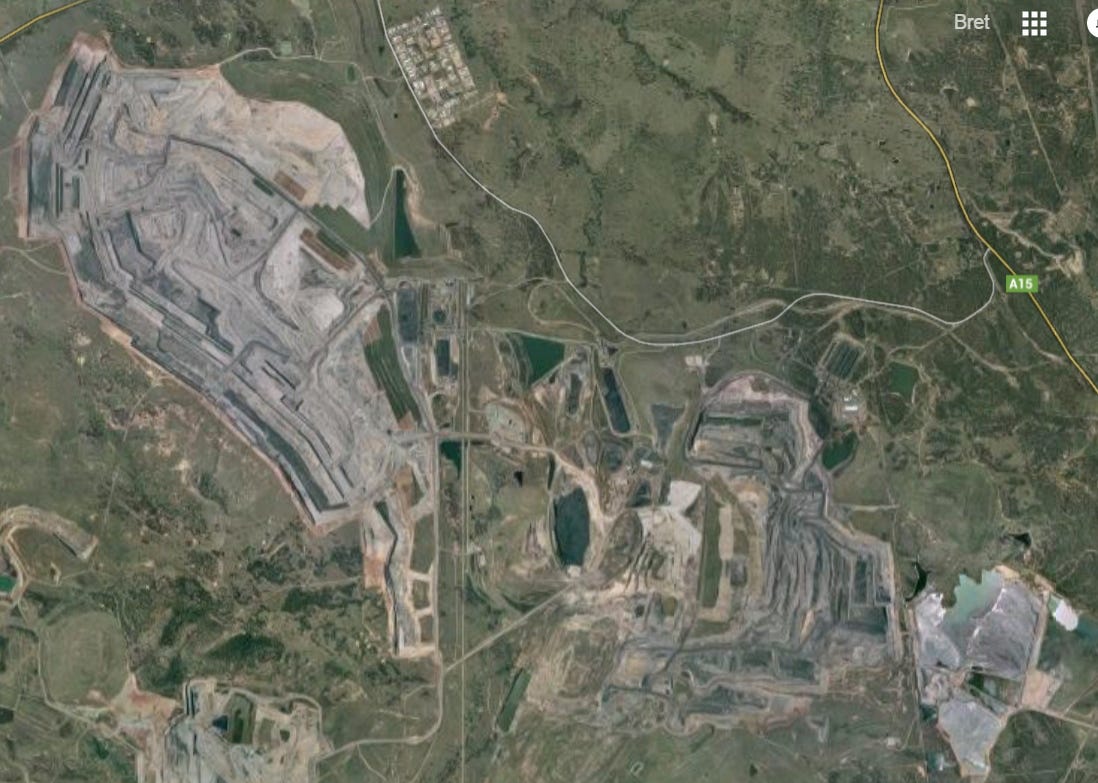
Some of that coal probably came from the Mount Arthur Coal Mine near Muswellbrook, less than 100 miles inland. It’s a BHP mine, producing about 15 million tons of coal annually. By Wyoming standards, that’s not very big, but much bigger mines are proposed.
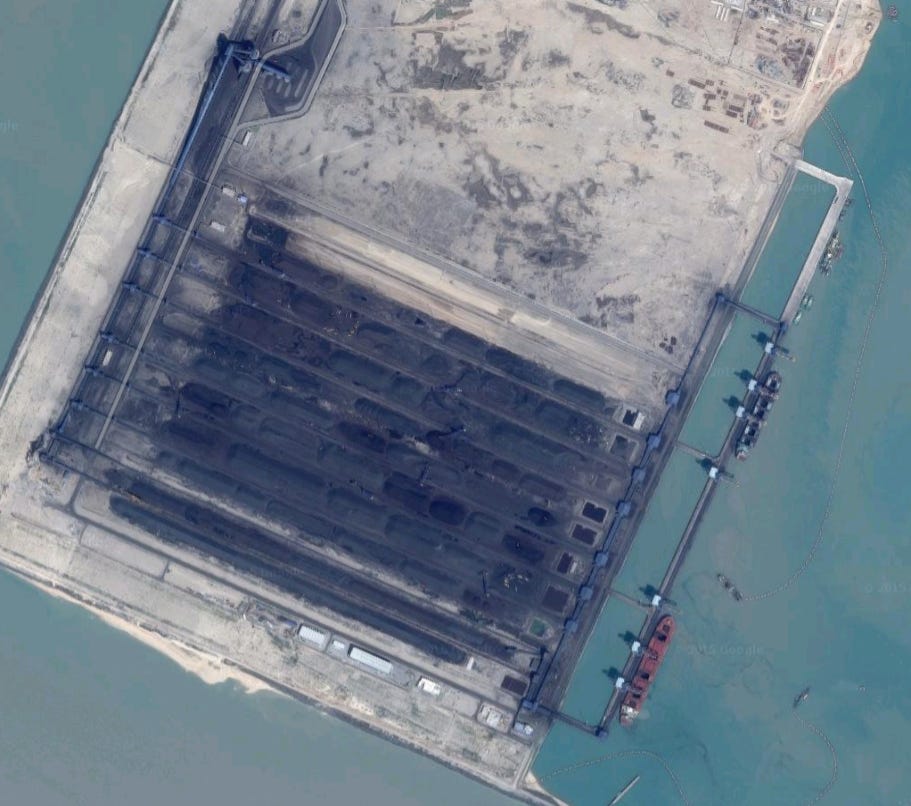
One of them, very controversial, is the Carmichael mine, intended to produce 60 million tons of coal annually for 60 years. The market: India. The developer: the Adani group, which is already importing coal from Indonesia to Mundra, in Gujarat. Bear in mind that India has lots of its own coal, but sometimes it’s easier for a power generator to buy coal in the world market. The lower image shows the coal pile at Mundra.
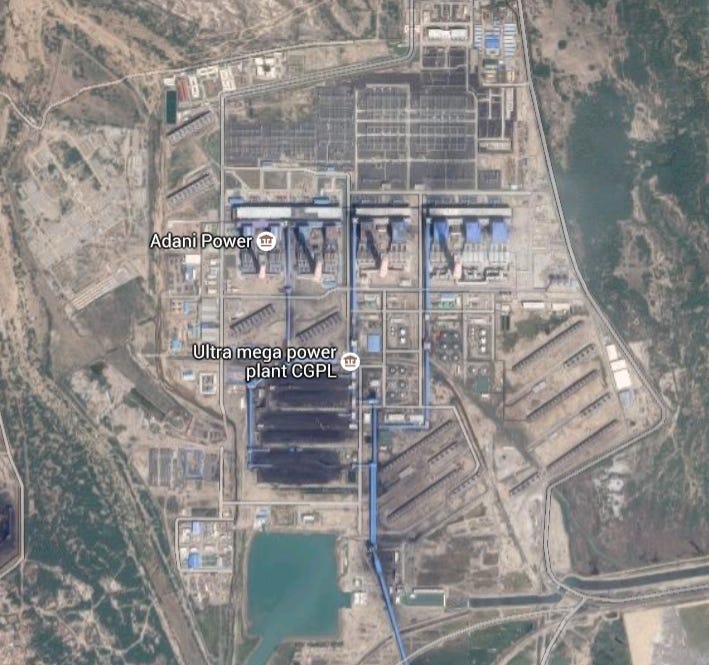
Go inland a mile or so and you can see the power plant burning that coal. This is a world-class plant, by some criteria the biggest in the world.
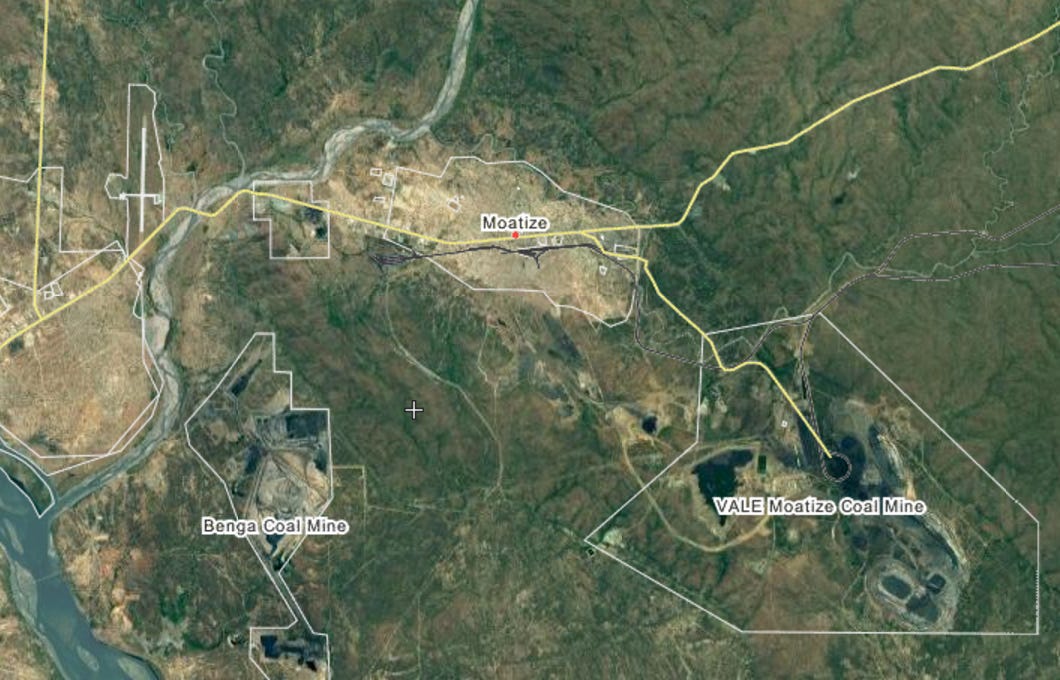
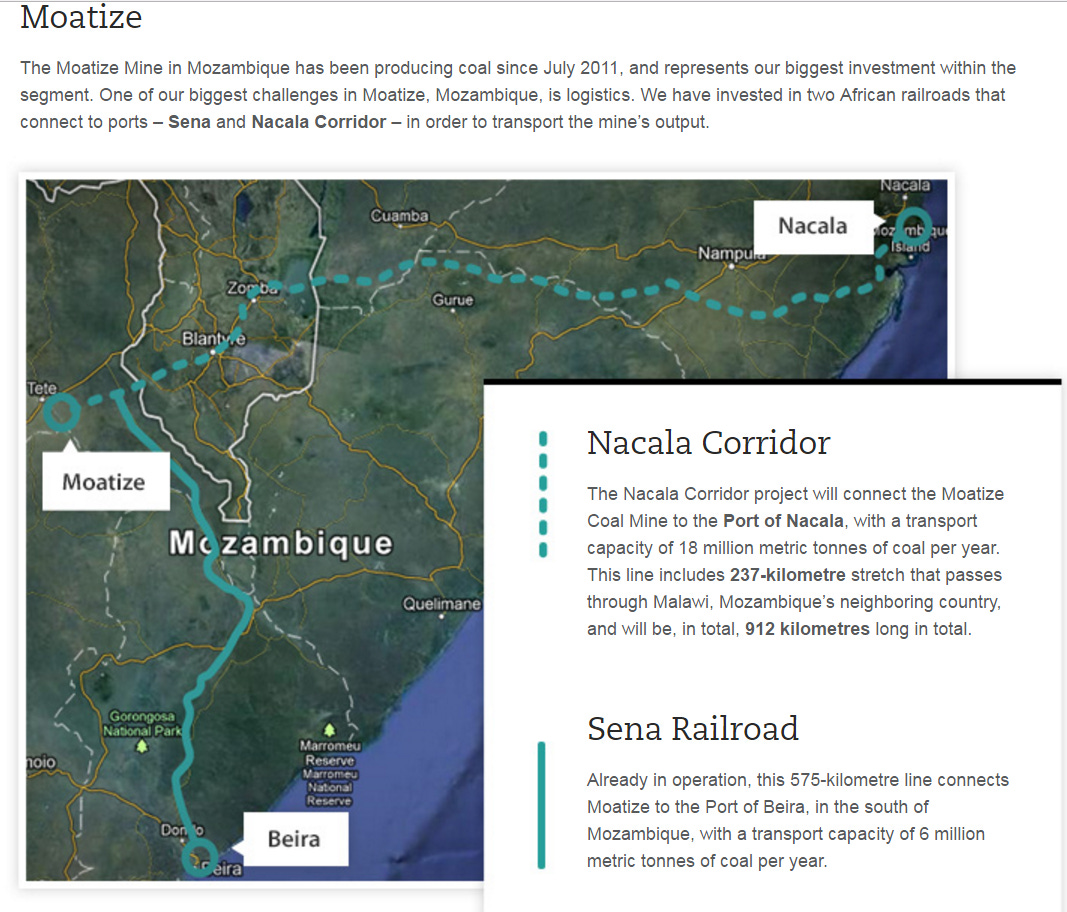
India’s hunger for coal recently led a group of Indian companies to invest in the world-class Benga coal mine at Moatize, Mozambique. The mine has a neighbor operated by Vale, the Brazilian iron-ore miner. Looks straightforward, doesn’t it? (Remember that huge dumptruck tray I showed you at the beginning of this file? This was its destination, I think.)
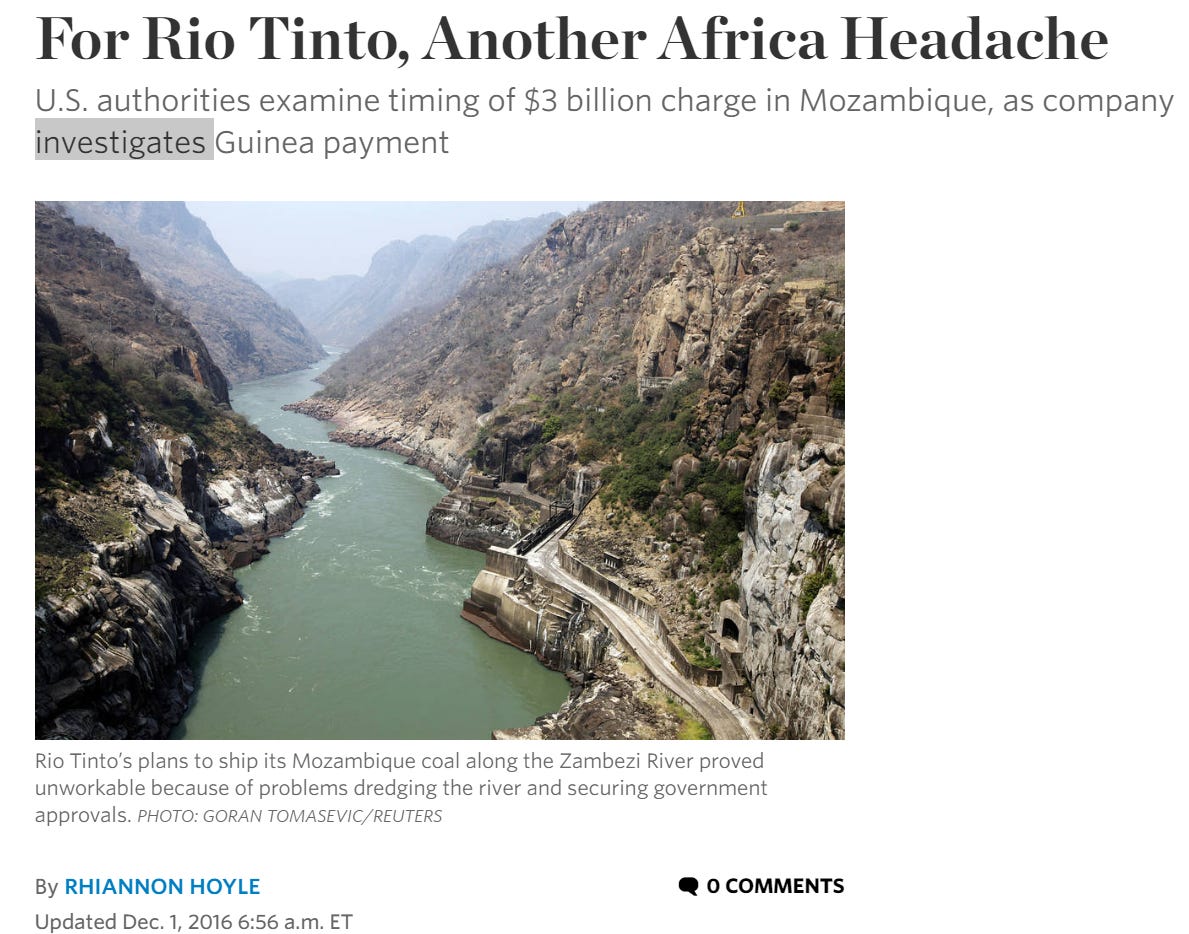
But not so fast. Indians bought the Benga mine in 2014 for $50 million from Rio Tinto, which had bought the mine three years earlier for $3.9 billion. Think that went over well with Rio’s stockholders? Heads rolled.
What was the problem? A large part seems to have been that the company assumed that it could barge coal down to the coast. Oops: the government refused to grant dredging permits. Which raises the question: how will the new owners ship the coal?
Answer: presumably the same way Vale is doing it at their own mine, namely by rail. But the existing rail line to Beira can’t carry nearly the output of these mines. Solution: t he Nacala Logistics Corridor, a new railroad to the deep-water port at Nacala.
Headaches, headaches, headaches—and coal miners in other places have even bigger problems.
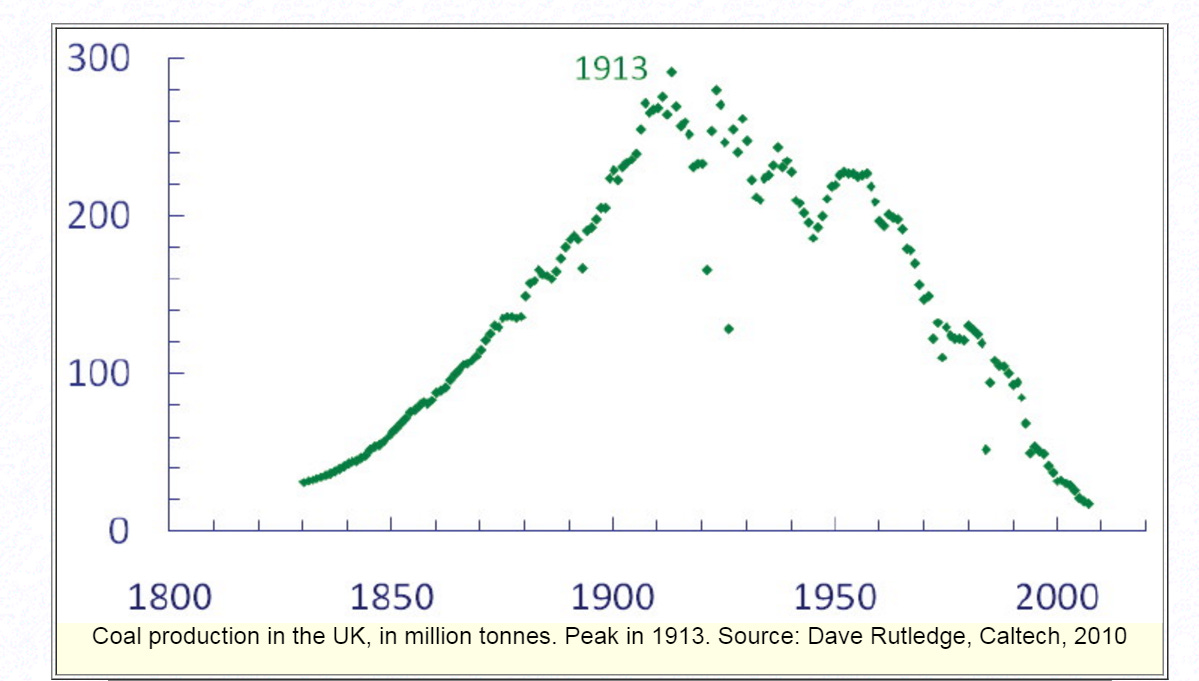
Production in the UK peaked around World War I, and even as late as 1954 the country had about 1,400 operating coal mines. Today it has about 20 open-pit mines but no underground operations. In 1920 the country had over a million coal miners; by 1960 it had 600,000; today it has perhaps a thousand.
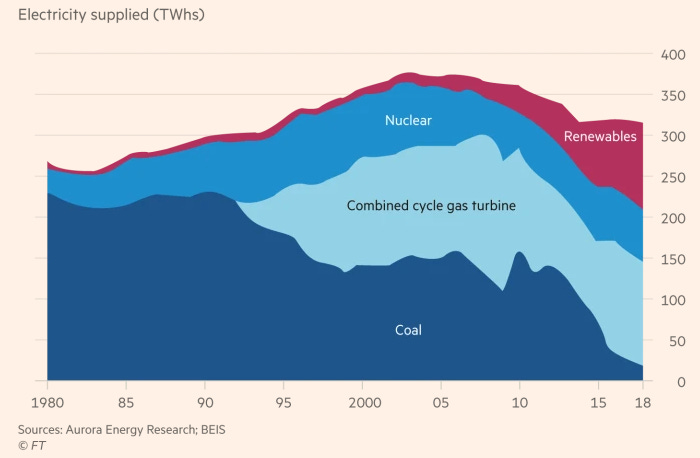
Britain has almost quit using coal to generate electricity. The small amount needed for blast furnaces is mostly imported from Russia, the U.S., and Colombia.
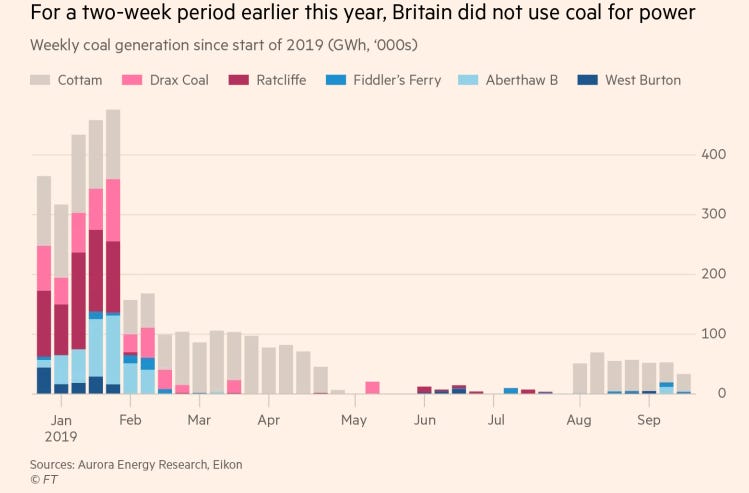
For a period in the summer of 2019, all UK electricity came from gas, nuclear, or renewables. It was the first time since 1882 that no electricity was generated in the UK with coal.
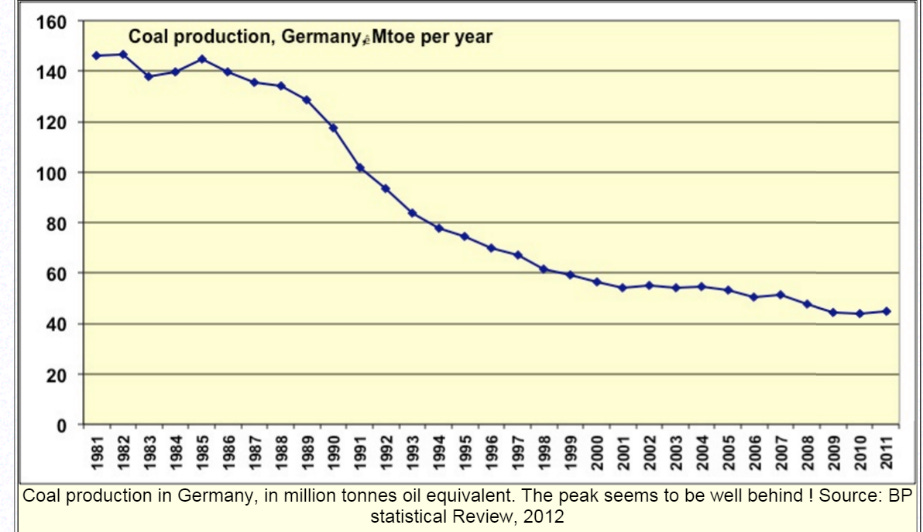
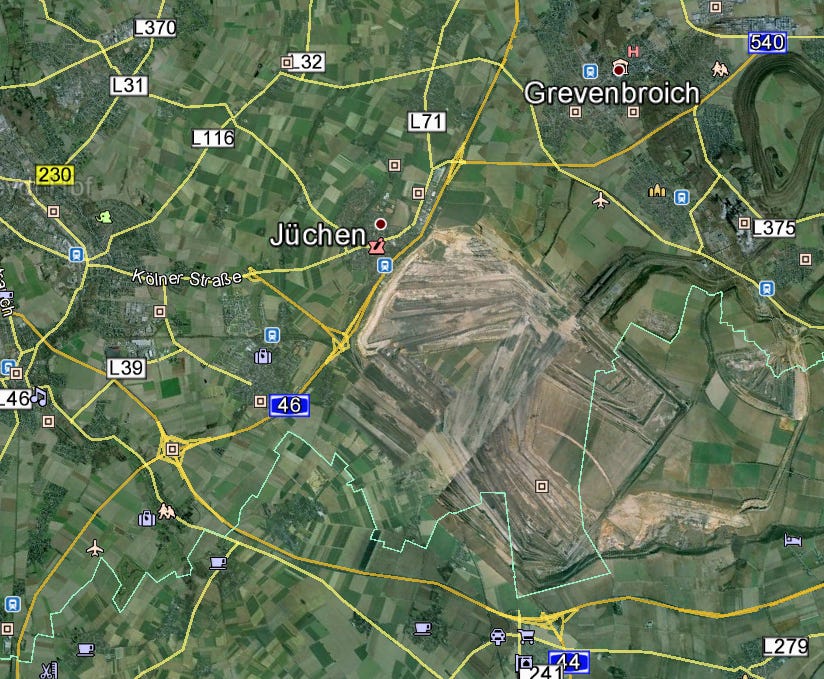
Here’s the difference: Germany is phasing out its underground mines, which are heavily subsidized, but it will continue for some years to produce soft coal (lignite) from surface mines. Here’s one of those mines, the Garzweiler mine, about 16 miles west of Düsseldorf. Grevenbroich bills itself as Germany’s energy capital, though the German government announced its intention of ending all coal mining by 2038.
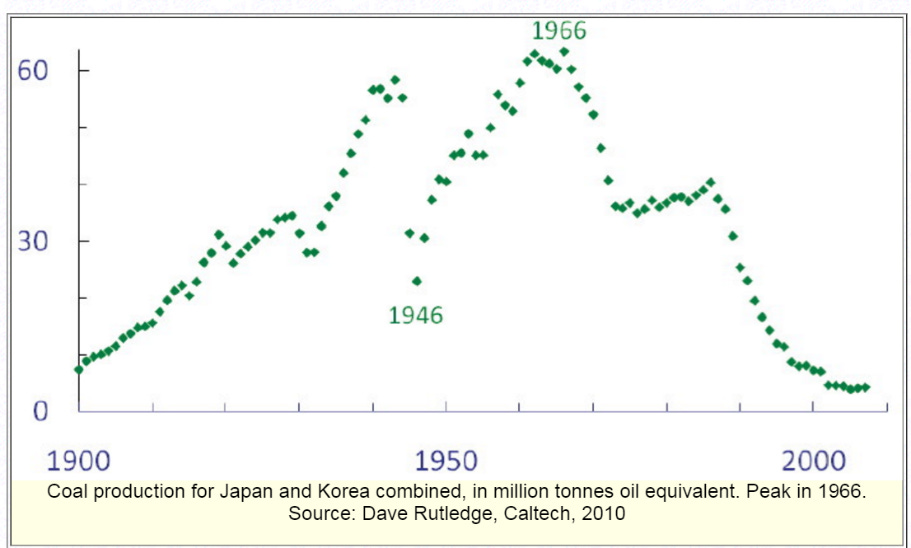
Here’s the graph for coal in Japan and Korea, combined.
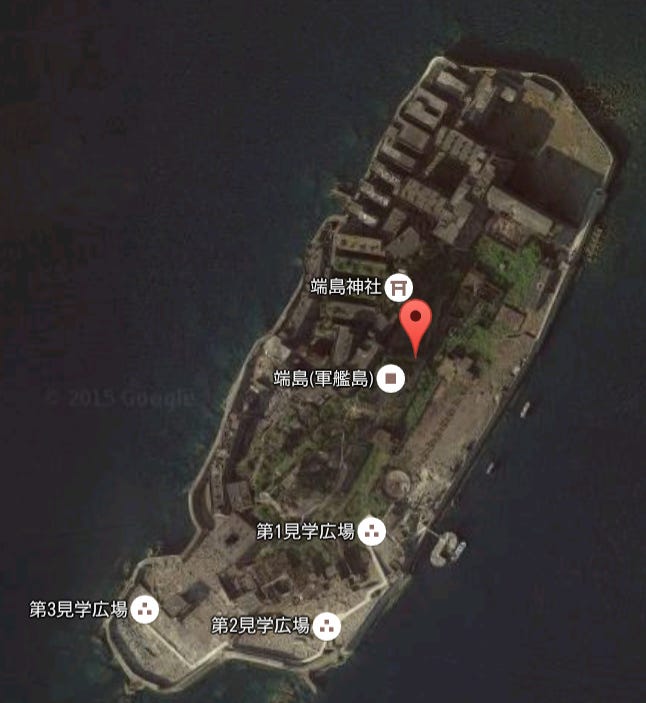
The death of the coal industry in these places has left behind a constellation of dead or dying towns. The most spectacular may be Hashima Island, now abandoned but where between 1890 and 1974 Mitsubishi mined coal from under the sea. At its peak, in 1959, over 5,000 people lived here; earlier, during WW II, Chinese and Korean forced-labor worked the mine.
If the place looks familiar, it may be because it was the location for the scene in Skyfall where Bond meets the bad guy (you remember: he was played by Javier Bardem). Here’s a 12-minute video about the place from Australian TV:
Just in case you’re wondering if there is any future for underground mining anywhere, the answer is sure, if the resource is valuable enough. Gold is Nevada is one example. So, even, is iron ore, mined deep underground at Kiruna, in Northern Sweden. (There are underground tours here, even in English.)
Gear shift: I want to look now hydroelectric power. It accounts for only three percent of the world's electricity production, but the social and environmental impacts of dams are huge.
Here's a map of hydro potential and production. North America has developed more than half its potential. So has Europe. Tremendous potential remains in most other parts of the world, especially Africa and China, though Russia isn't far behind. It's a good bet that most of Africa’s potential is on the Congo. For China, it's on the Jinsha, or upper Yangtze. The one region that shows up devoid of hydropower is the Middle East, though this really isn't quite true. Some of the streams in the Zagros Mountains of western Iran have been dammed and equipped with power stations.
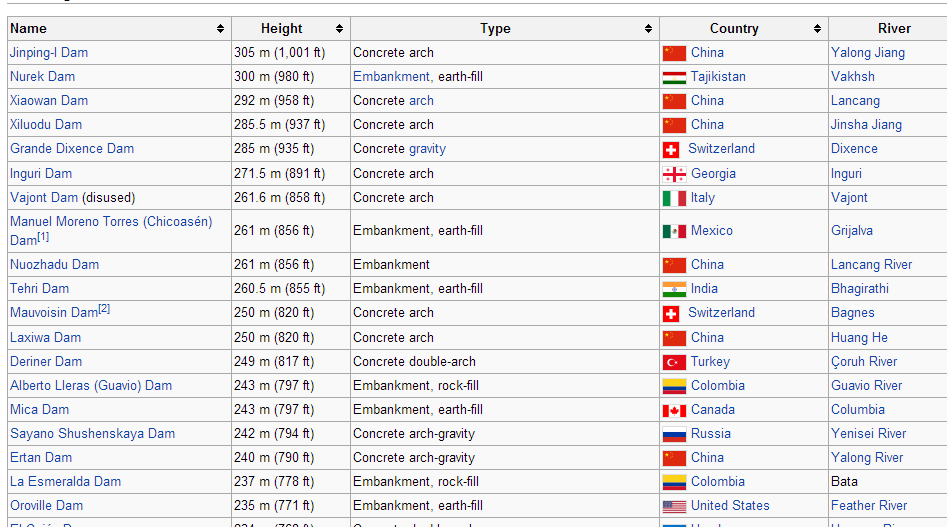
Many people thinking of big dams think of a dam’s height. This list only goes down far enough to pick up the first U.S. dam, which is in California. (It was in the news in 2016 for almost failing.) There are six higher dams in China; no other country has more than two. The implication is that the Chinese are ambitious engineers.
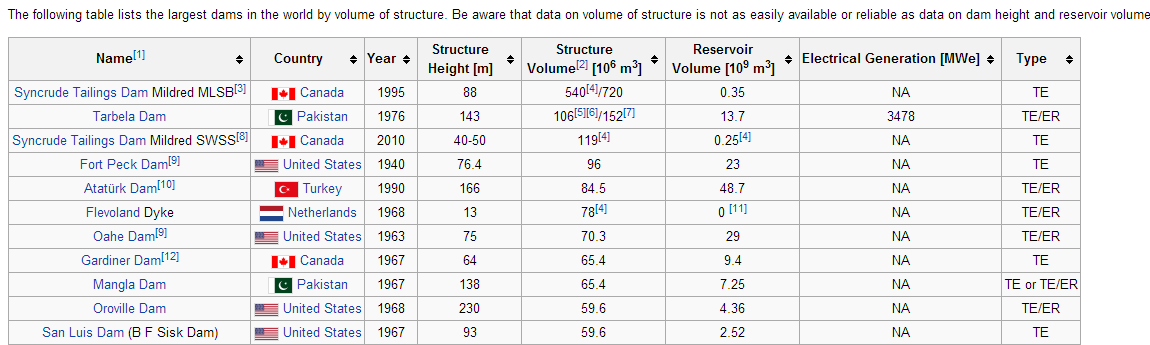
Another measure is the volume of material in the dam. This is interesting because #1 and #3 were built in connection with the development of the Athabaska tar sands of Alberta. Tarbela is on the great river of Pakistan, the Indus. Interestingly, the U.S. shows up here four times, the first two both on the Missouri River.
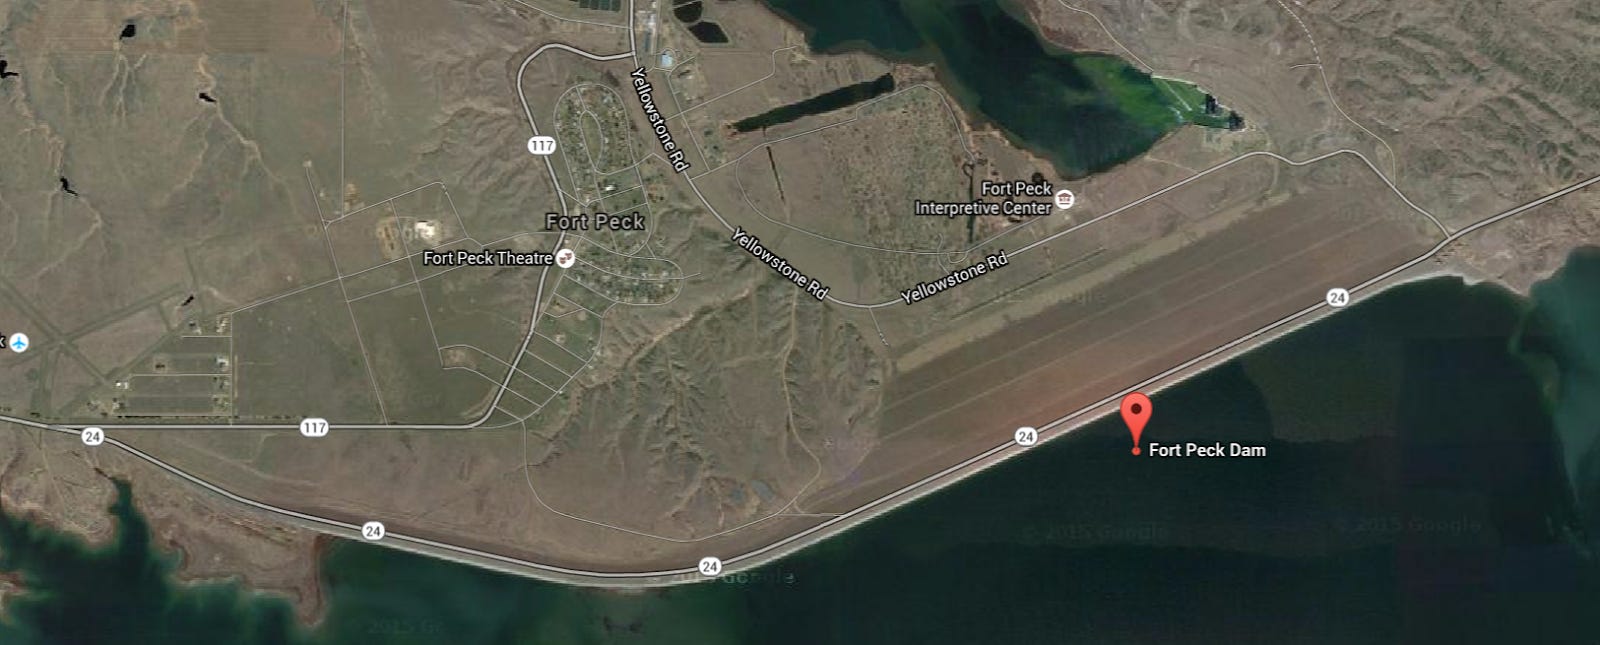
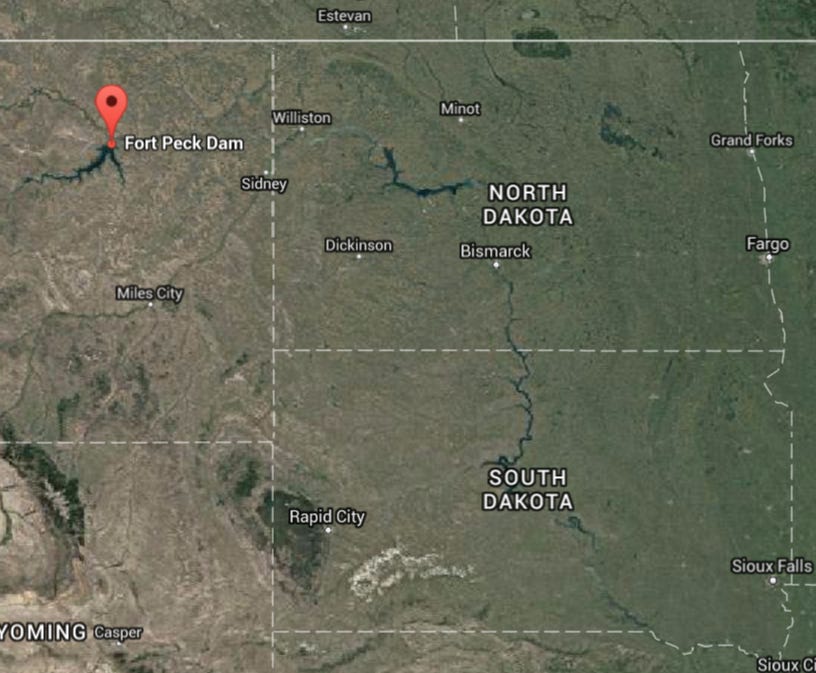
Here’s Fort Peck.
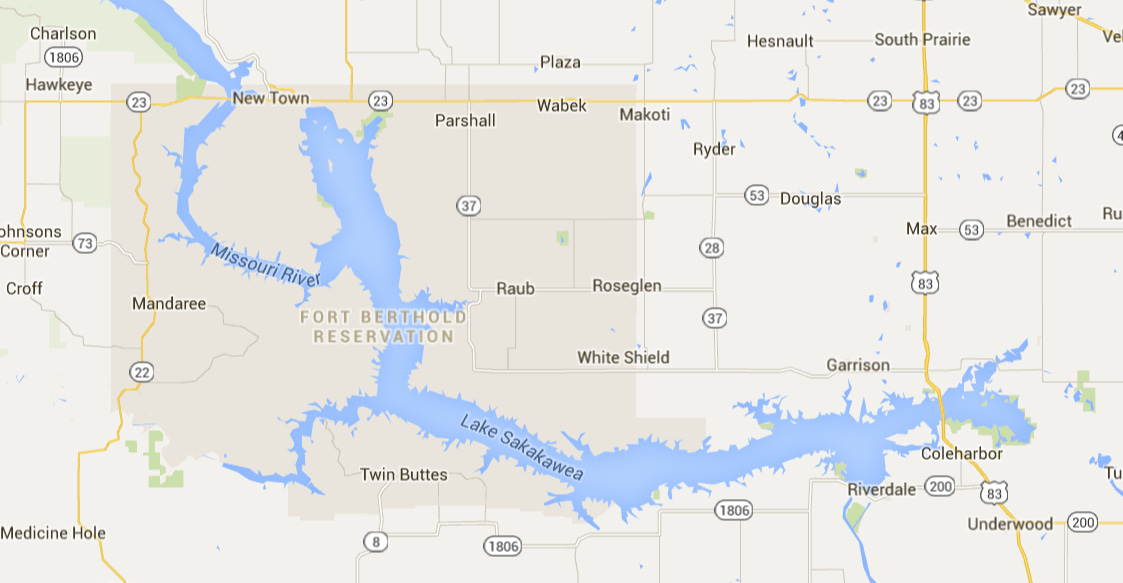
The other Missouri River dam on the list is the Oahe, hidden here under the label “South Dakota.” Just upstream from the label “North Dakota” is a third big dam on the Missouri. It’s the Garrison Dam, built in the 1950s.
As you can see, the reservoir cuts the Fort Berthold Reservation in half.
Here’s the U.S. Secretary of the Interior in 1948 signing the legal settlement in which three tribes (the Mandan, Hidadsa, and Arakara/Sahnish) accepted about $12 million in exchange for relinquishing about 150,000 acres that are now under water. The alternative was to have the land condemned. Everyone seems OK with the deal except the man representing the tribes, who lost their best land and were forced to relocate. Nobody seems to notice that he’s crying.
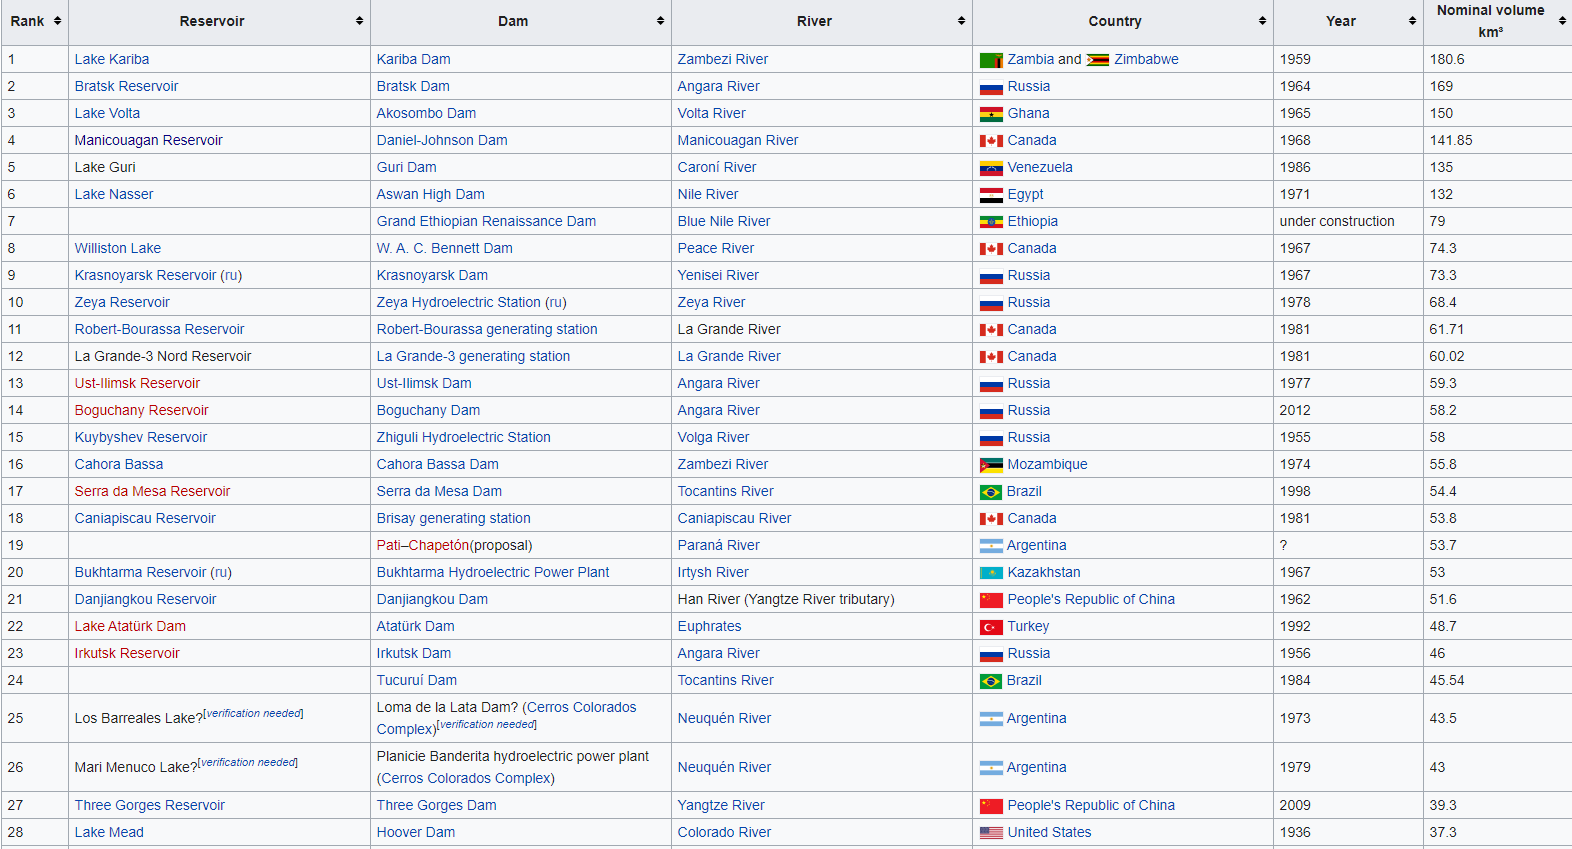
Still another measure is the volume of water held behind the dam. No. 1 is downstream some 200 miles from Victoria Falls on the Zambezi River, which forms the border between Zambia and Zimbabwe. No. 2 comes out of a reservoir downstream from Siberia’s Lake Baikal.
The biggest reservoir in the U.S. is No. 29, Lake Mead, behind Hoover Dam. Its capacity is less than a quarter the size of #1 (the reservoir volumes are expressed in the far-right column in cubic kilometers). Three countries dominate the list: Russia, Canada, and China.
You’ve heard of Lake Mead but probably not of the engineer for whom it’s named. He was Elwood Mead. We’ll save him for another day.
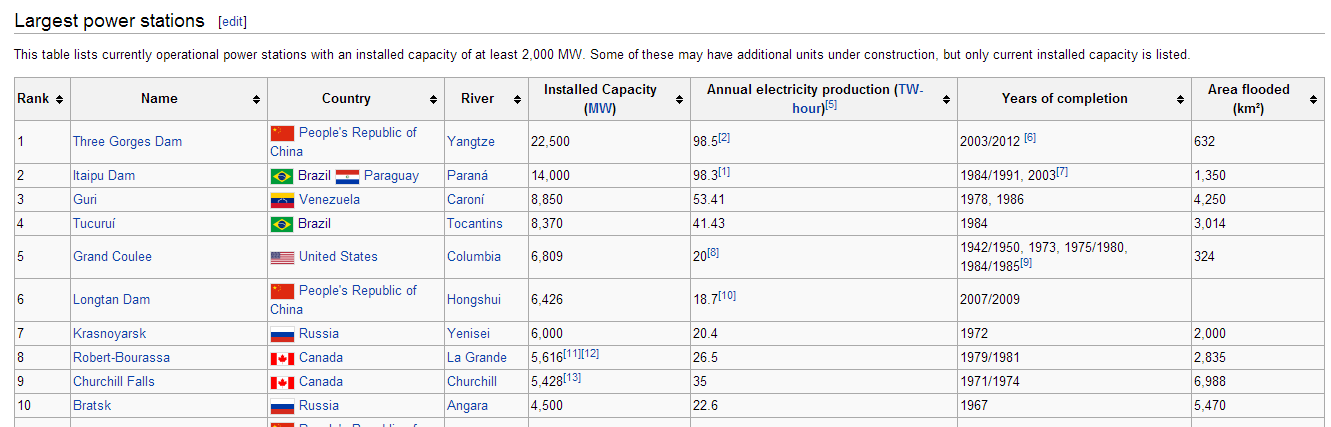
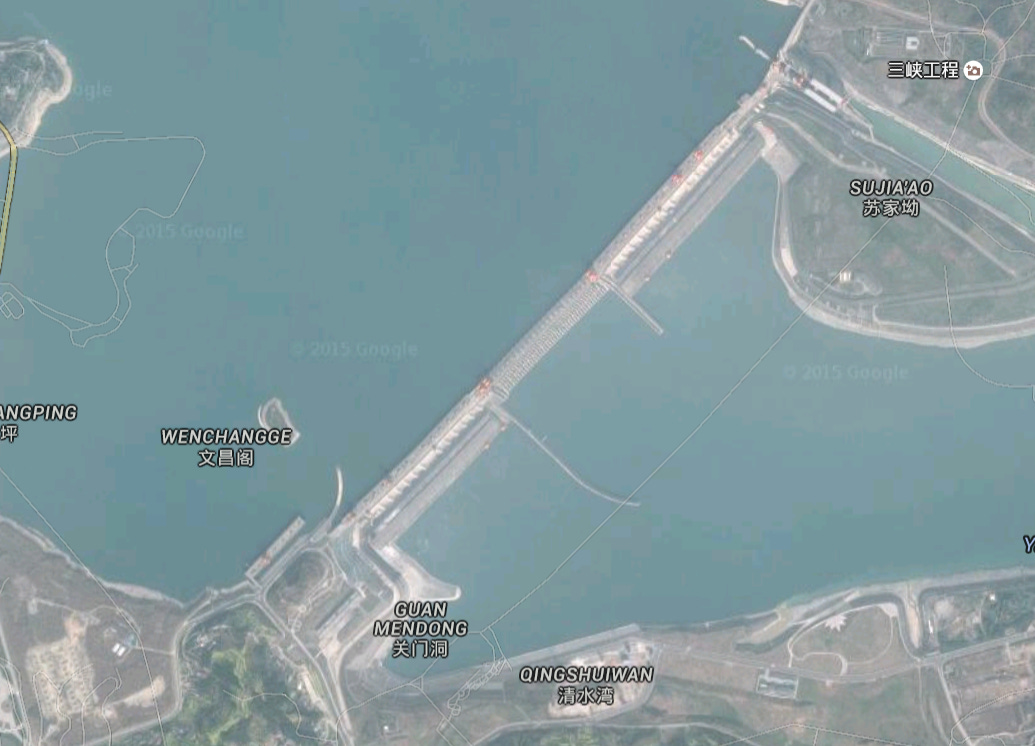
It’s about time we got to ranking dams by their hydropower capacity. At the top of the list is China’s Three Gorges, which ranks #24 on reservoir size and doesn’t even show up on any of the other lists we’ve seen.
Here it is.
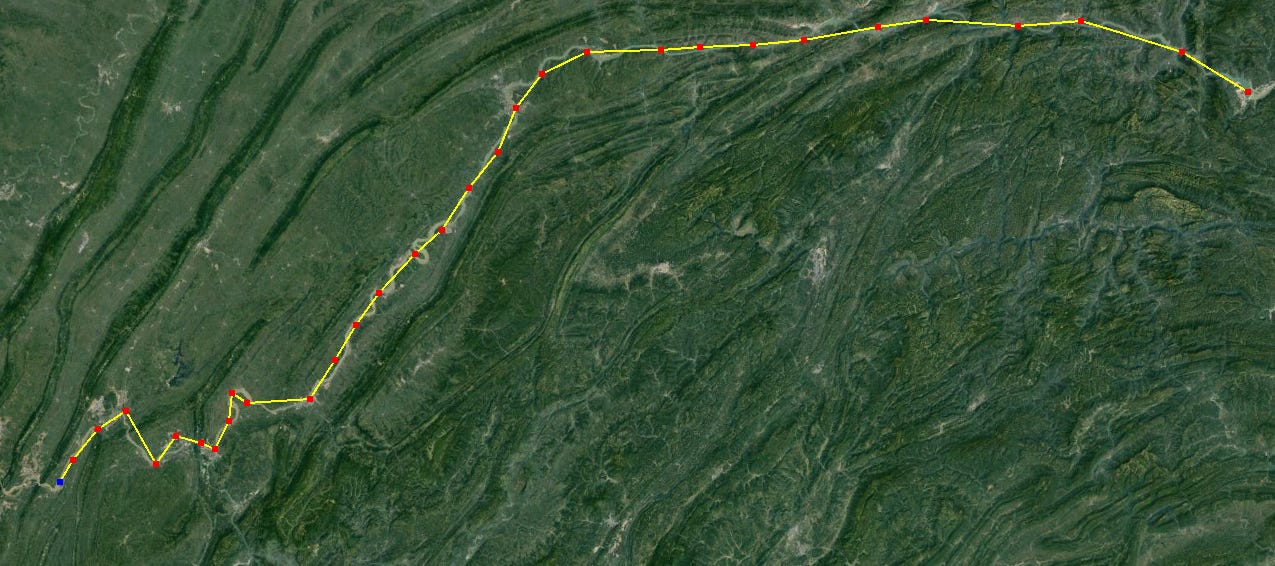
I’ve marked out the course of the reservoir which stretches about 300 miles upstream to Chongqing, which is just beyond the left margin.
At that point, this is how the reservoir looks. The point is that this reservoir may not make the list of the biggest in the world, but it’s still big by any intuitive measure.
The Dafushi Bridge crosses the river downstream from Chongching.
Who began the engineering studies for the Three Gorges Dam? Answer: John L. Savage, the engineer who earlier supervised the designs of Hoover Dam and Grand Coulee. Here he is on the Yangtze in 1944. Think the Chinese want American assistance in designing dams today?
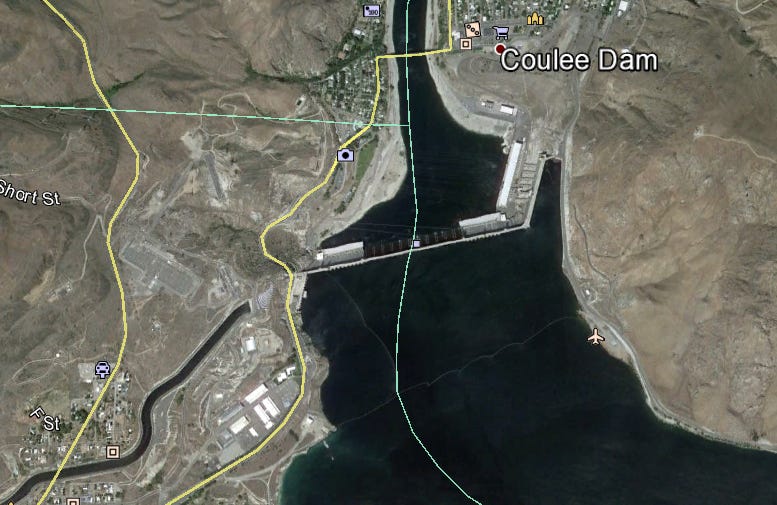
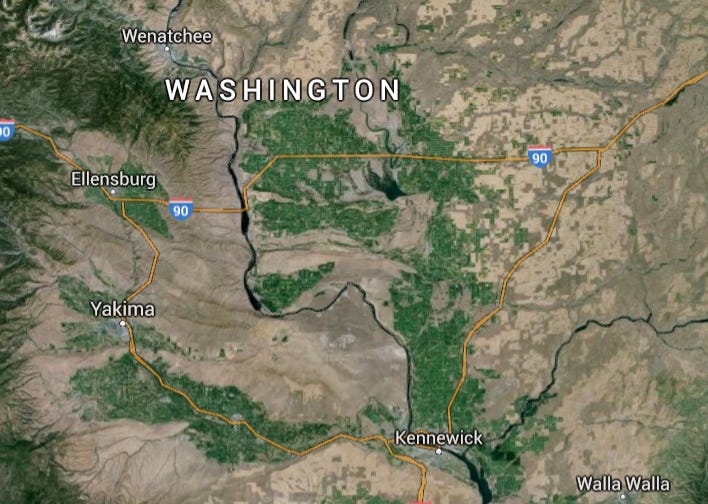
Here’s Grand Coulee, the biggest hydropower producer in the U.S. Much of the power goes to pumping water uphill several hundred feet so it can enter that canal you see at the lower left.
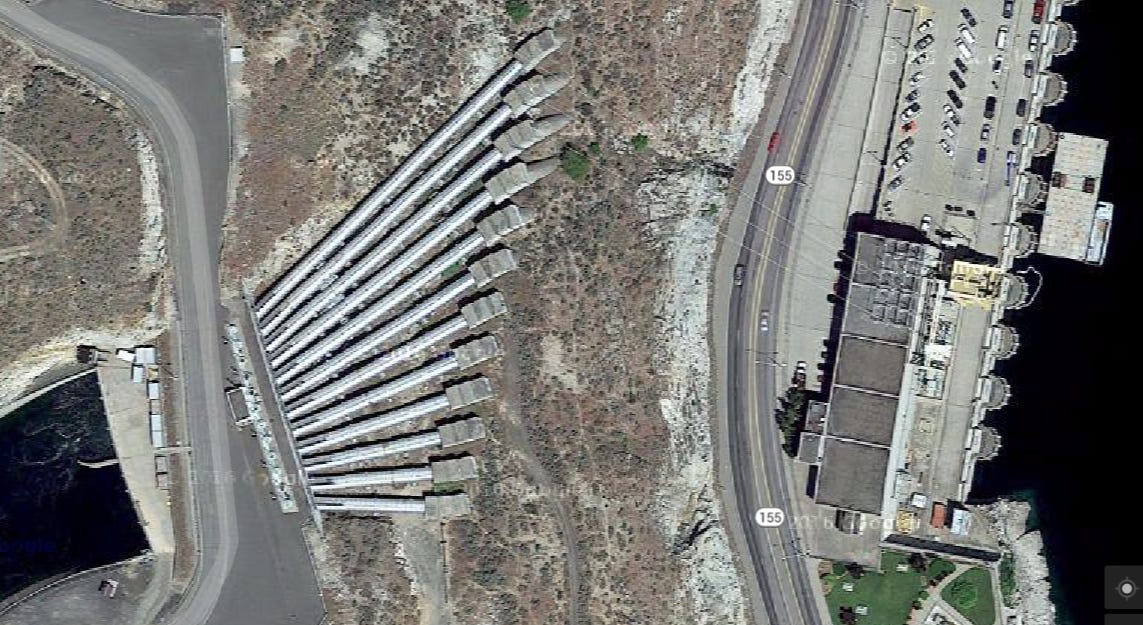
Here it is up close. The pumps in the building on the right push water up through those pipes into the canal. To do it, they use power generated in the adjoining powerhouse.
Here’s the canal on the ground.
The canal branches into the equivalent of capillaries, here with plastic check dams and siphon pipes to get water into the furrows across a corn field.
The system irrigates about half a million acres traversed by I-90 and extending south to Kennewick. It’s the Columbia Basin Project, built mostly in the 1950s. What’s grown? Think potatoes first, for French fries. Is this a sensible use of electrical power? I bet the potato growers of Maine, squeezed out of business by farmers here, don’t think so. “Hey,” they may say, “our crops wither in dry years for lack of rain. You guys get good crops with irrigation that you couldn’t possibly afford if the government didn’t sell it to you below cost. That’s not fair.”
They’ve got a point, but Maine has two congressmen; Washington has 10.
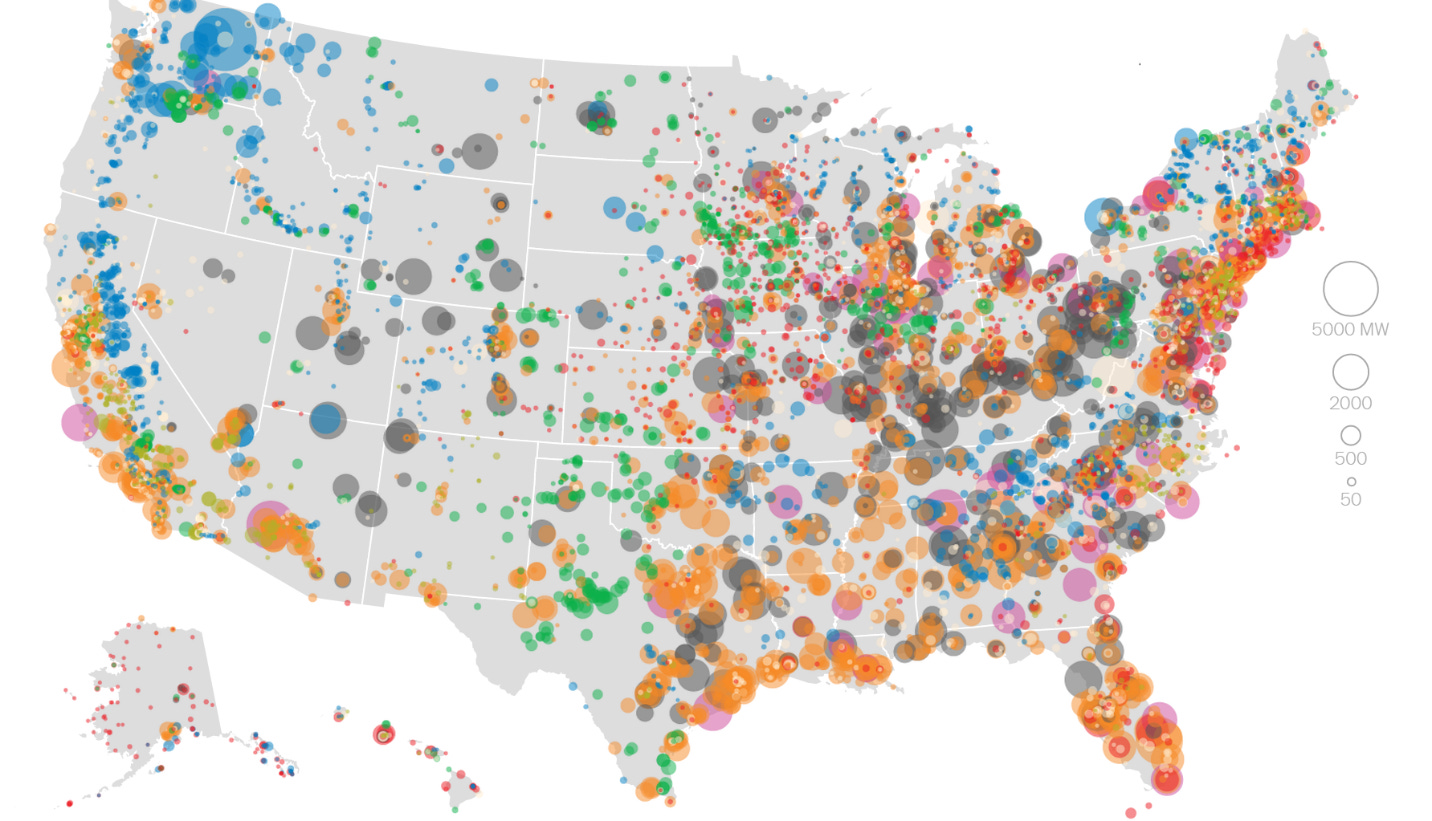
U.S. hydropower plants are shown here in blue. (Orange is gas-fired; gray is coal, green is wind.)
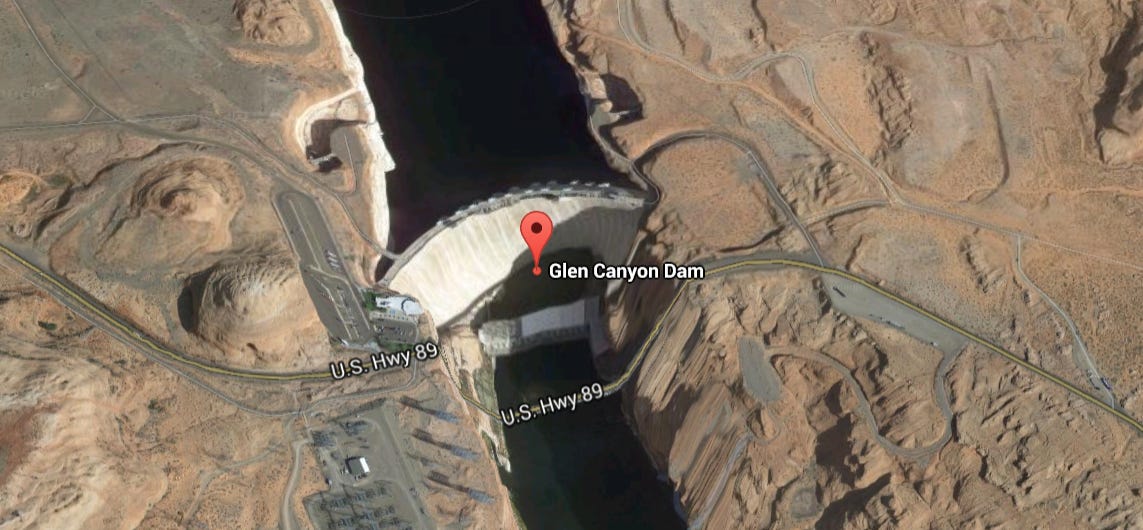
Grand Coulee dominates in the Northwest. One of the larger eastern dams is at Lewiston on the Niagara River just downstream from the falls. (Most of the water that would go over the falls is diverted for power. Don’t tell visitors.) Notice the dam on the Utah-Arizona line?
It’s Glen Canyon, the last big dam built in the U.S. It forms Lake Powell on the Colorado River upstream from the Grand Canyon. Environmentalists fought to stop the dam, lost the battle, but won the war. Meaning: we don’t build big dams any more.
Just after the Civil War, John Wesley Powell led the first expedition to take a boat down the Colorado through the Grand Canyon. Here’s Powell before he grew the beard that he wore throughout later life.
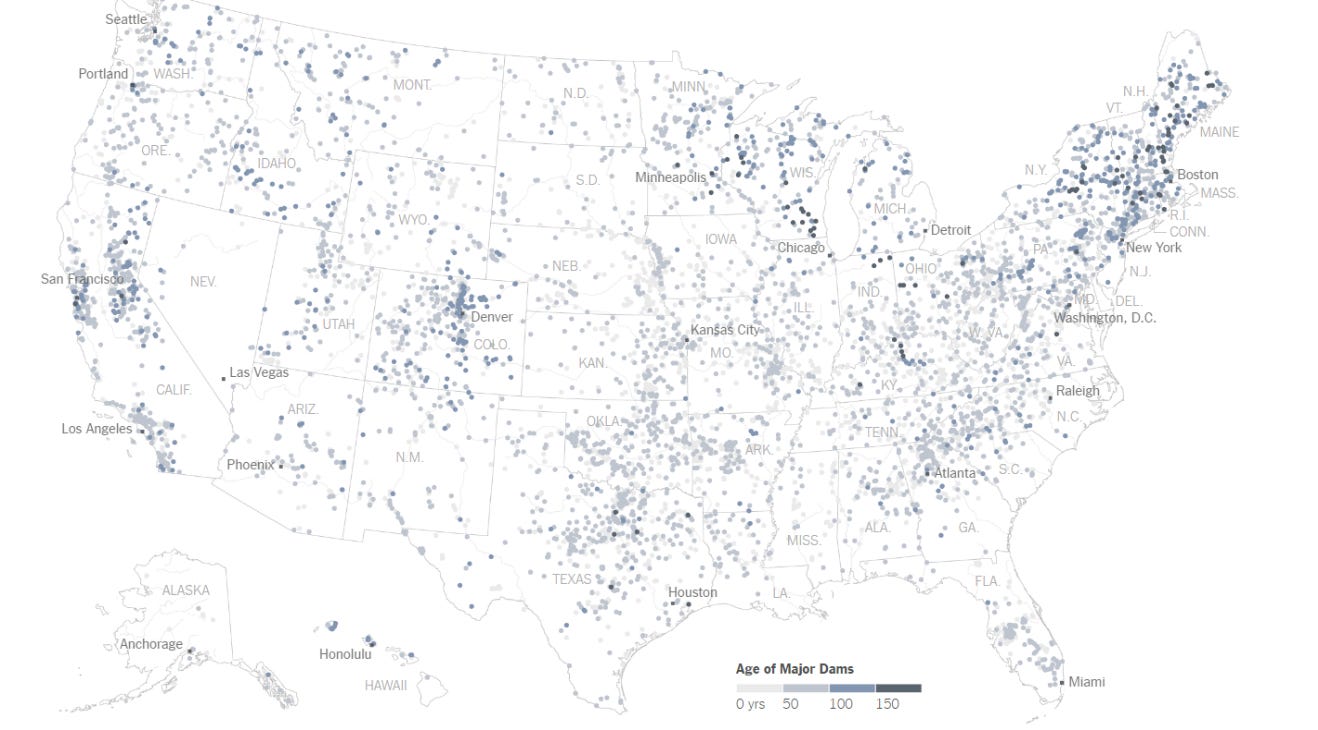
The Army Corps of Engineers counts 91,457 dams in the U.S., by the way. Only the larger ones are shown here.
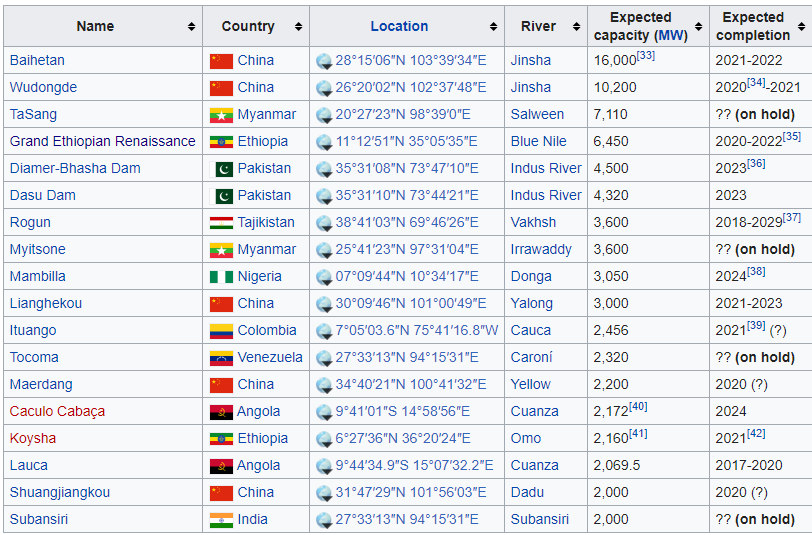
Elsewhere in the world and despite resistance, many countries continue building big dams. Here are the biggest under construction now. None is in the U.S.
The Chinese are in a bind on this. If they build dams, they run into opposition from environmentalists and activists fighting for villagers and farmers forced to move. (For the Three Gorges Reservoir, 1.2 million people had to move.)
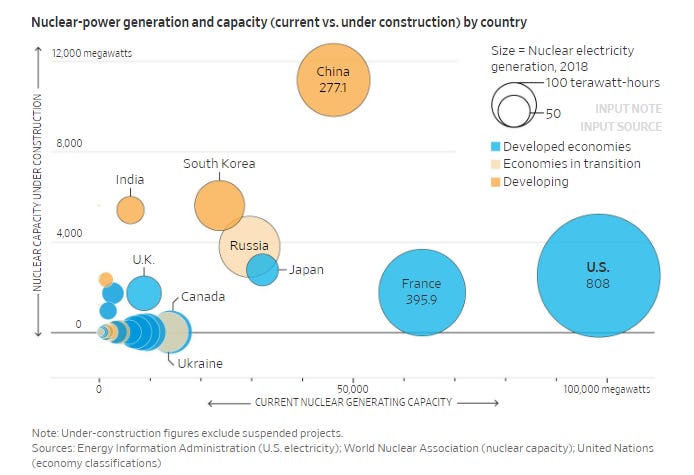
If the Chinese don’t build dams, on the other hand, they have to find some other source of electricity. More coal? That brings its own problems. Nuclear? Ditto. Solar and wind? Sure, but that’s a big hill to climb, as this pie chart suggests.
The Chinese are investing in all these things. For example, they’re building more nuclear plants than anyone else. Shall we applaud this or deplore it? Choose your poison.
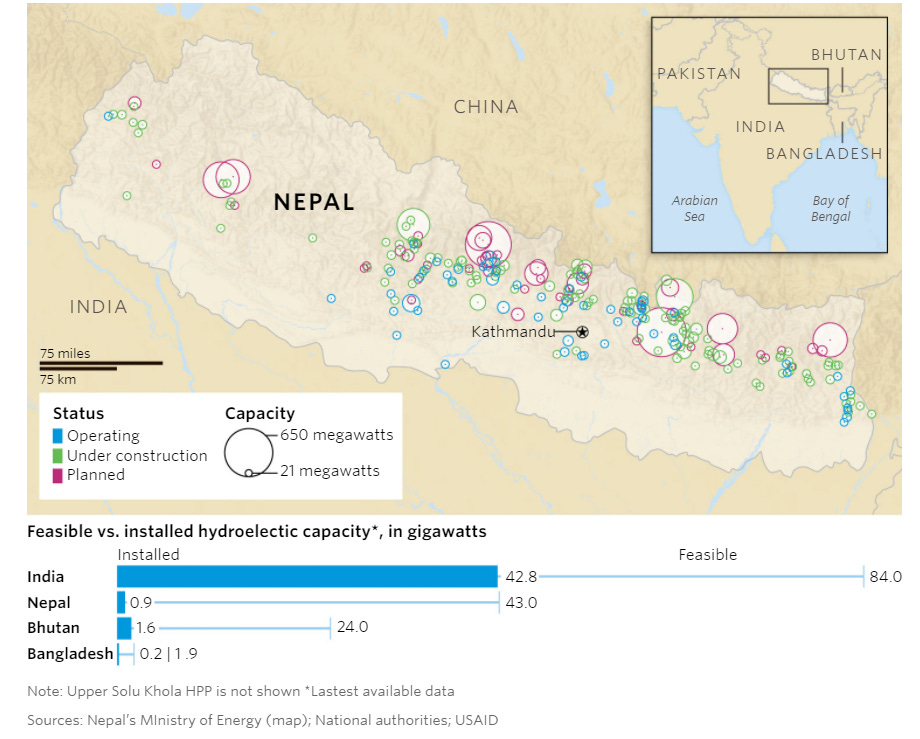
The purple circles are planned hydro projects in Nepal, which hopes to make money selling electricity to India. As the bar chart suggests, Nepal has barely begun to develop its hydro potential. The risks (earthquakes, for starters) are huge, but so are the potential profits. And it’s not like Nepal has a lot of choice. A Nepalese engineer says, “The only resource we have, like the Arabian countries have oil, is water.”
The Mekong has tremendous hydropower potential. The Chinese already have a bunch of dams on the upper river, with more planned. There’s potential downstream, too, and some developed power, but China creates problems for its downstream neighbors by reducing streamflow during the wet season, when the water supports downstream fisheries, hydropower, and irrigation. China blames the low flows on drought, but that’s probably not the whole story.
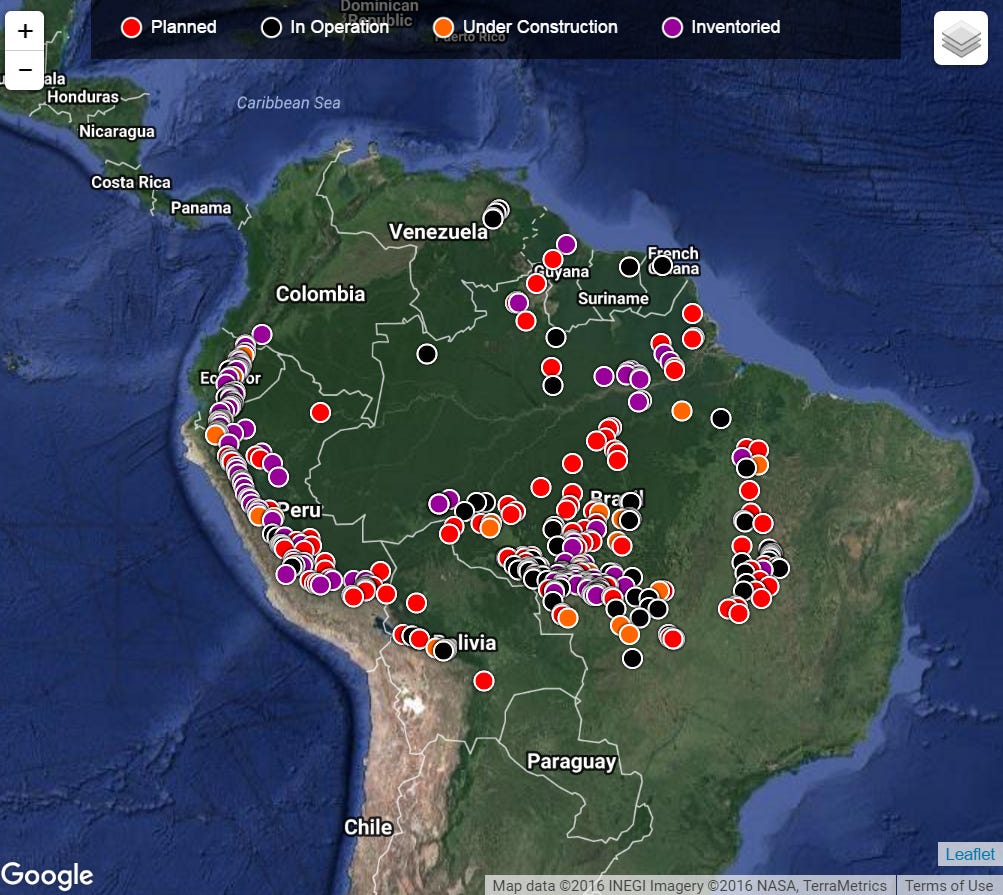
There are only a few hydropower projects operating in the Amazon Basin (black circles), but there are several under construction (orange) and a zillion planned (red) or inventoried (purple).
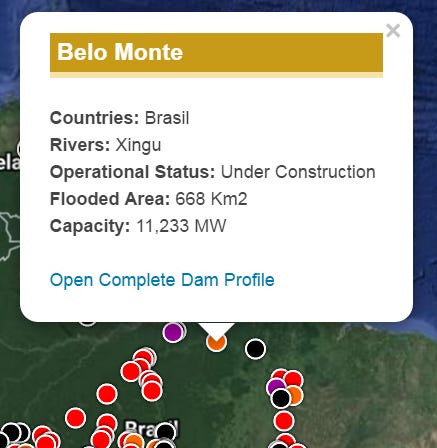
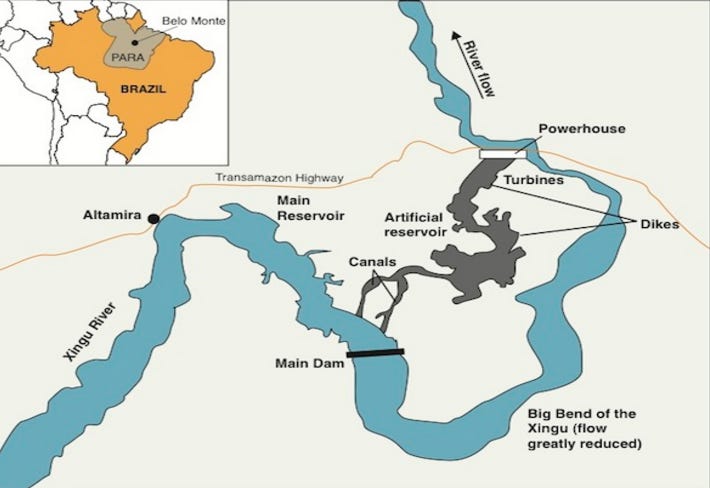
Here’s the biggest of them; Belo Monte, on the Xingu. At 11,000 megawatts, it’s number two in the world and has already begun power generation, though not at capacity.
Here's another giant. It's the Grand Renaissance Dam that Ethiopia is building on the Blue Nile just a few miles before that river flows into Sudan. The power plant at the dam will have an installed capacity of 6,000 megawatts, the biggest in Africa, and Ethiopia hopes to earn lots of money by selling surplus power to neighbors including Sudan. Maybe things will work out that way, but there’s a debate about whether the river has enough water to run the turbines at capacity year round or merely during the summer flood. A lot depends on rainfall in the coming years. It may well increase, which sounds good, but so may the frequency of drought, which doesn’t.
Even though the dam isn’t designed to divert water from the river (as, for example, Grand Coulee does, for irrigation), filling the reservoir will inevitably reduce the amount of water flowing downstream while the dam fills. Ethiopia would like to get the turbines spinning, but Sudan and Egypt would prefer the reservoir fill slowly.
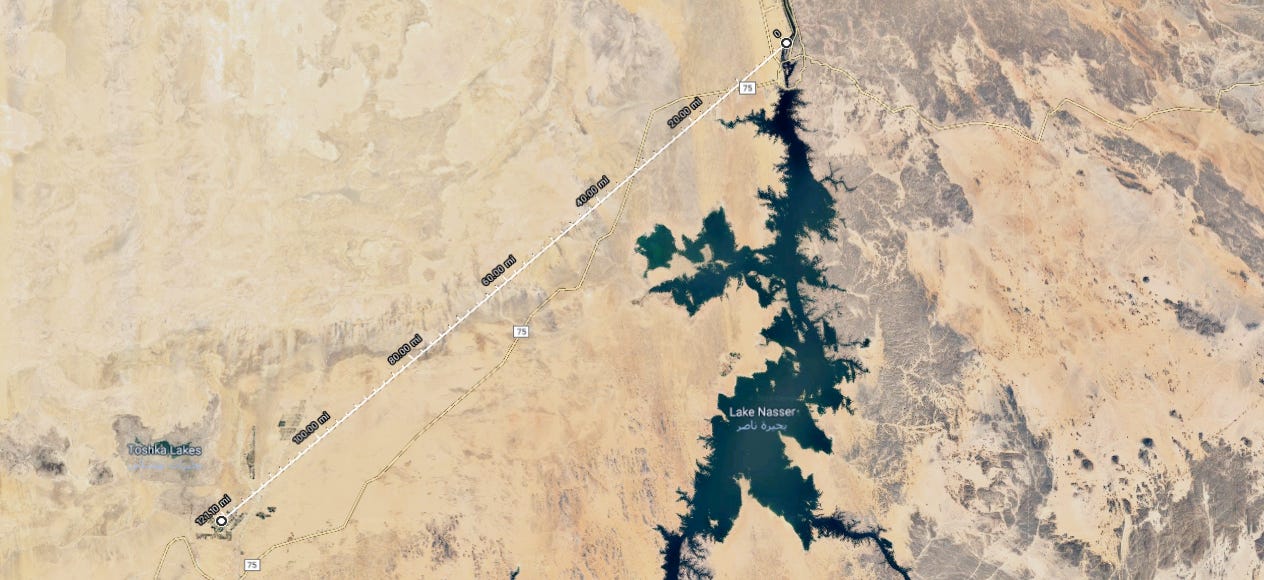
Even without the dam, Egypt and Sudan face water shortages. Here’s a ruler stretched from Egypt’s High Aswan Dam west to the Toshka Lakes.
Egypt and Sudan have encouraged foreign investors to come in and develop modern farms here. In this case Saudi and UAE investors paid for center-pivot sprinklers mostly irrigating alfalfa. Inevitably, this means less water for Egyptians farther downstream, where the river at its mouth is only a trickle. Meanwhile, the center pivots at Toshka are semi-abandoned, although this may be for reasons other than water shortage. You can see the same kind of failed project farther upstream at Atbara, in Sudan.
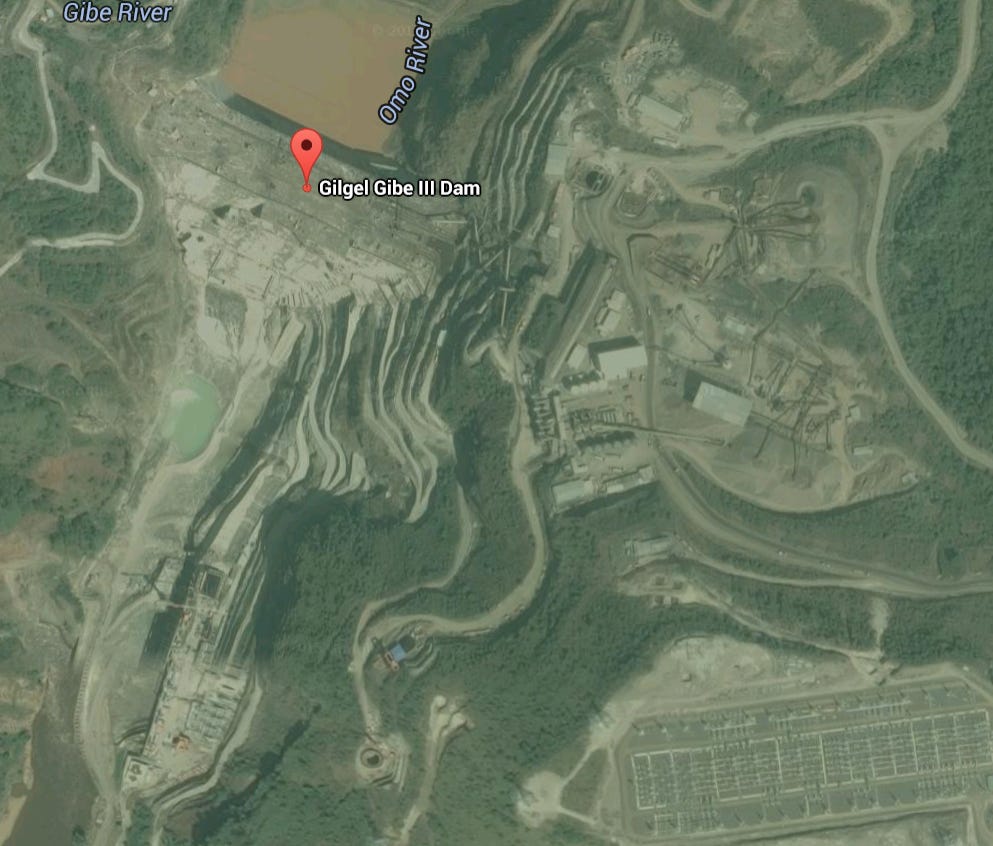
Here’s another Ethiopian dam, Guri III, on the Omo River. This is one of several dams in a cascade on the Omo River, which flows south into Lake Turkana. The Ethiopian government is keen not only to generate power but in this case to divert stored water into canals irrigating sugarcane.
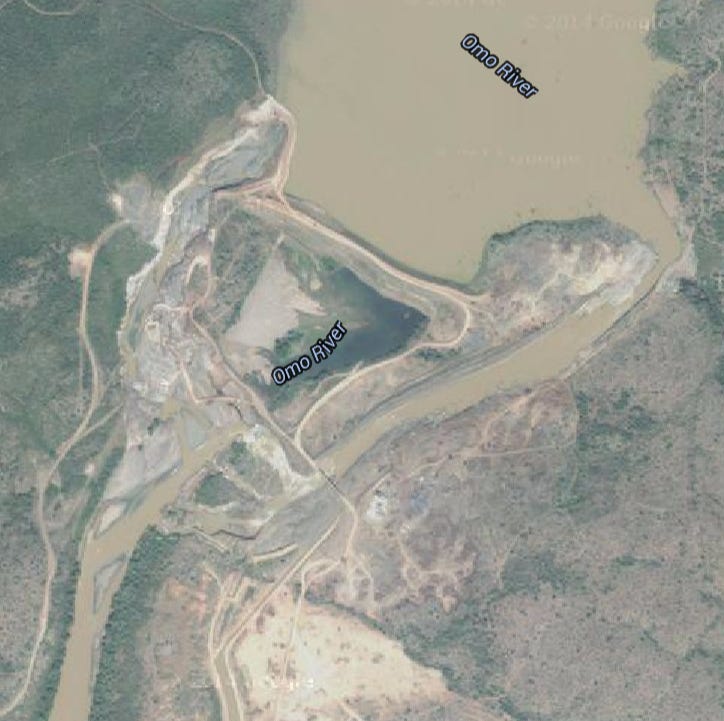
You can see development already beginning 100 miles downstream. There’s a small dam there ponding the river and diverting some water into a canal.
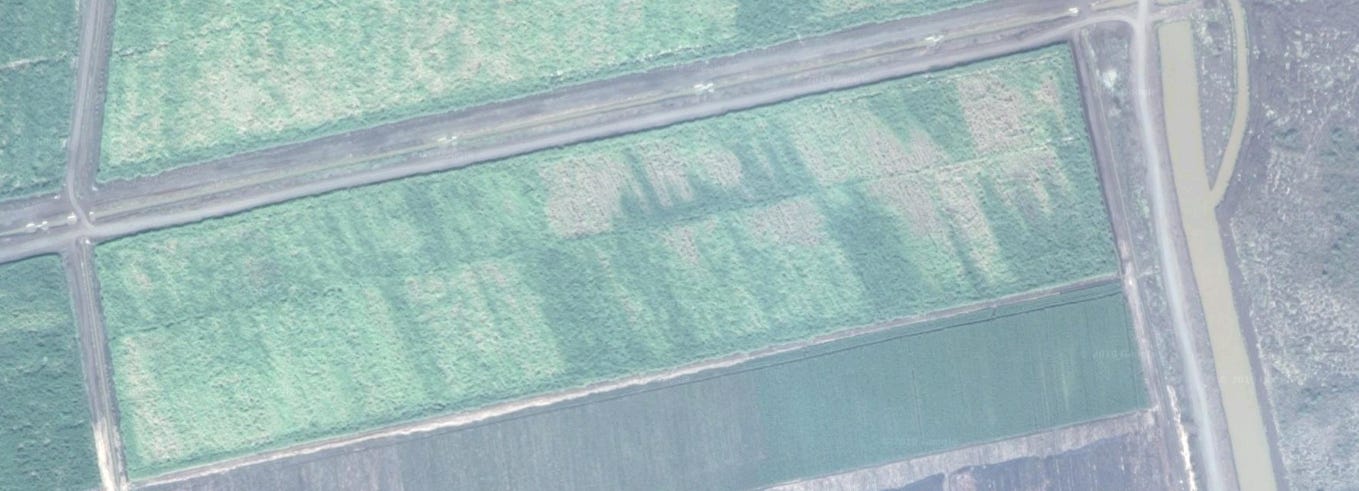
Follow the canal downstream and you bump into sugarcane fields. Will these diversions shrink Lake Turkana? Of course. Environmentalists can object, but you can imagine the Ethiopian reply: “Didn’t you Americans develop your water resources? You may have quit building dams now, but we’re catching up with you.”
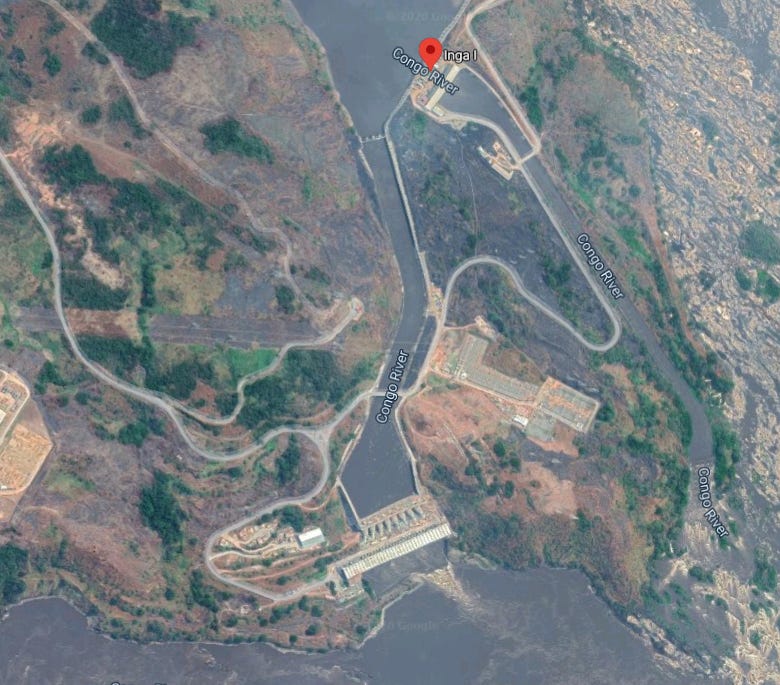
Meanwhile, the Congo River 140 miles downstream from Kinshasa has a site, Inga, with the capacity to generate twice as much power as Three Gorges. In other words, to beggar every other project on earth. Will it ever happen? Baby steps were taken with Inga 1, completed in 1972 and Inga 2 a decade later. Both have maintenance problems and operate at less than half capacity. Inga 3 has been discussed, along with a set of dams called Grand Inga. Will they ever happen? There’s no huge number of people to resettle, and there’s no big problem with downstream neighbors worried about reductions in their water supply. But the DRC is not the easiest place to work, it’s not at all clear if power sales would help the people of the DRC (apart from a few), and there’s the question of what to do all the electricity. Send it north to Europe? South to South Africa?
Here’s Inga 1 and Inga 2. The water is flowing from top to bottom; the main channel is at and beyond the right edge of the image.
Here are the penstocks bringing water to the Inga 1 powerhouse.


")


#/media/File:Rio_tinto_river_CarolStoker_NASA_Ames_Research_Center.jpg)